Correction: The earlier version stopped at the 2024 data. This version includes the 2025 release, which expands the endpoint group from eight districts to 17 and updates every chart and cohort count.
Seventeen of the 34 Florida districts with complete records that began below an 80% graduation rate in 2016 finished above 90% in 2025. The same endpoint test identified eight districts in 2024, so the group more than doubled with the latest release.
The comparison uses 73 stable district IDs with complete data across 10 adjacent reporting years, from 2016 through 2025. Three partial or nonbaseline IDs are excluded because they do not have the full span. That fixed universe keeps a new or short-lived reporting unit from changing the denominator.
Every district in the 2025 endpoint group
| District | 2016 | 2025 | Improvement | Cohort (2025) |
|---|---|---|---|---|
| Florida School for the Deaf and the Blind | 47.1% | 93.5% | +46.4pp | 62 |
| Putnam County↗ET | 63.6% | 96.6% | +33.0pp | 673 |
| Florida Virtual School↗ET | 66.6% | 97.0% | +30.4pp | 1,233 |
| Jefferson County↗ET | 70.0% | 92.7% | +22.7pp | 55 |
| Walton County↗ET | 77.3% | 97.5% | +20.2pp | 826 |
| Holmes County↗ET | 72.4% | 92.3% | +19.9pp | 234 |
| Volusia County↗ET | 76.0% | 95.6% | +19.6pp | 4,968 |
| Pasco County↗ET | 79.1% | 96.9% | +17.8pp | 6,159 |
| Lake County↗ET | 78.1% | 94.4% | +16.3pp | 3,592 |
| Columbia County↗ET | 75.0% | 90.7% | +15.7pp | 591 |
| Duval County↗ET | 78.8% | 94.3% | +15.5pp | 8,540 |
| Citrus County↗ET | 79.0% | 94.1% | +15.1pp | 1,077 |
| Washington County↗ET | 76.3% | 91.2% | +14.9pp | 249 |
| Charlotte County↗ET | 77.4% | 91.6% | +14.2pp | 1,482 |
| Monroe County↗ET | 77.9% | 91.9% | +14.0pp | 706 |
| Broward County↗ET | 78.7% | 91.4% | +12.7pp | 19,373 |
| Hillsborough County↗ET | 79.1% | 90.9% | +11.8pp | 16,893 |
The average improvement across the 17 districts was 20.0 percentage points.
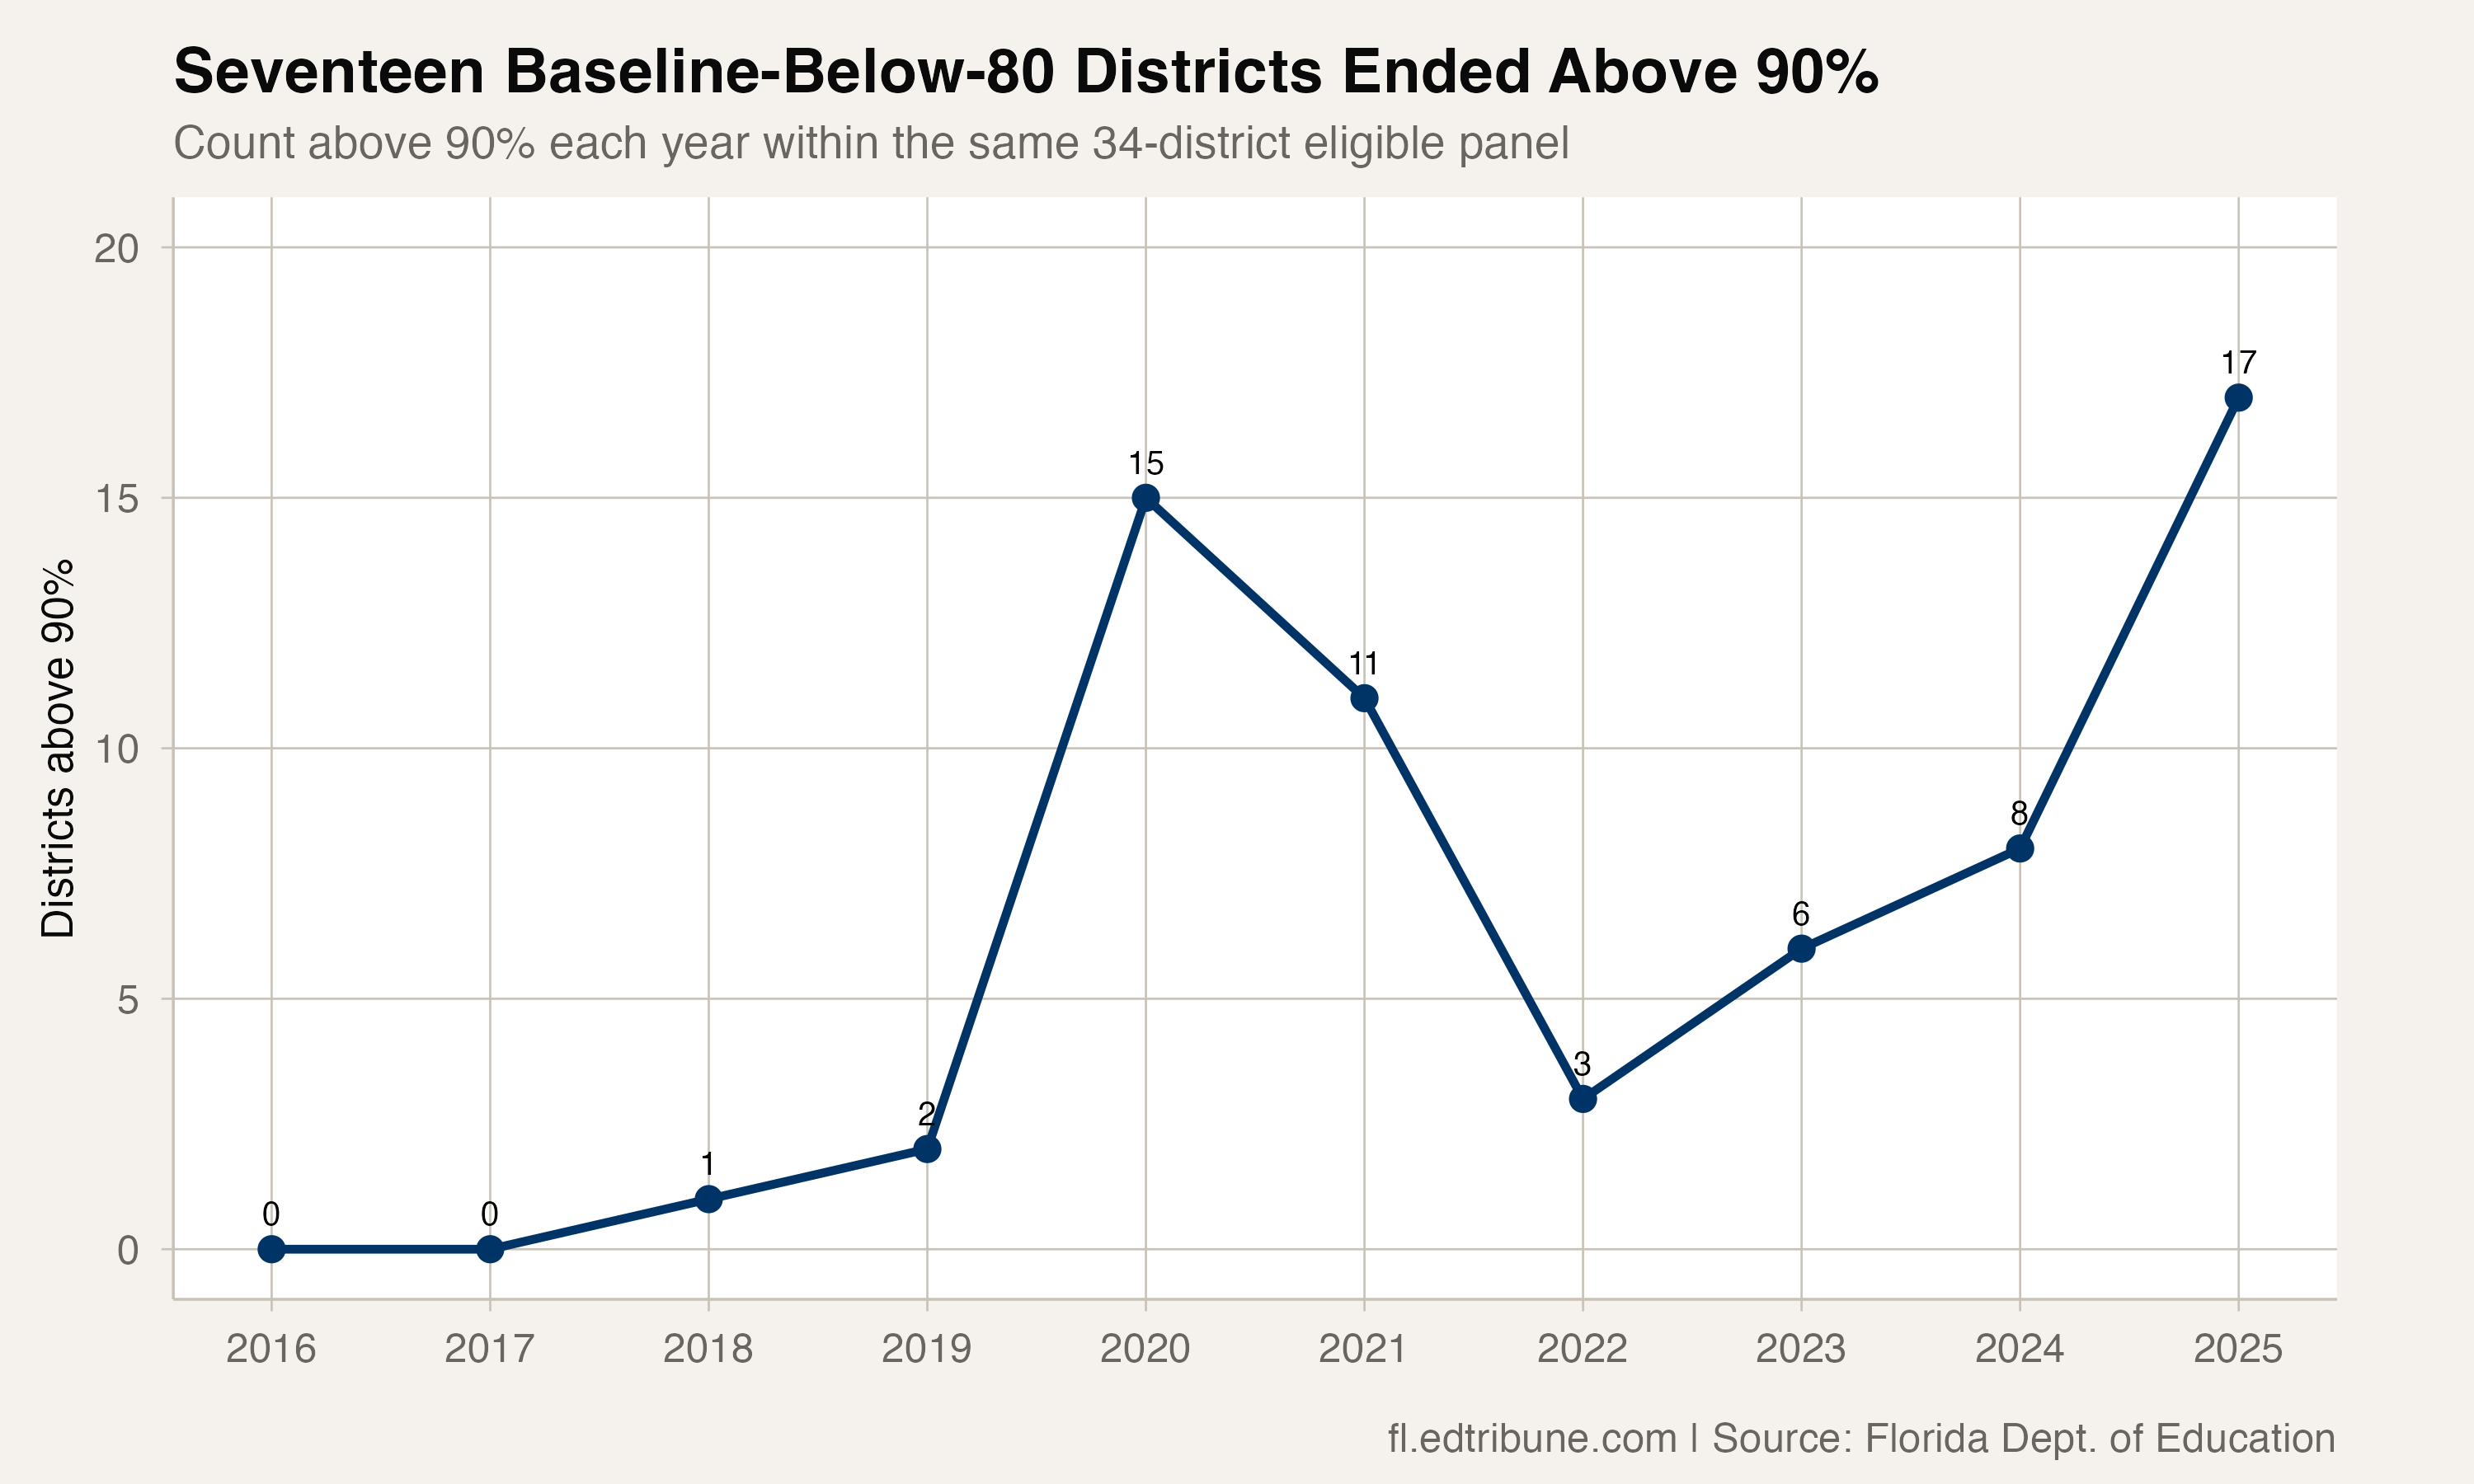
Nine districts changed the endpoint count
All eight districts that met the test in 2024 remained above 90% in 2025. Nine more joined them.
Four of those nine crossed above 90% for the first time in the available panel: Broward, Hillsborough, Jefferson and Washington. The other five had crossed earlier, later returned to 90% or below, and moved above the line again in 2025: Charlotte, Columbia, Holmes, Monroe, and the Florida School for the Deaf and the Blind↗ET.
That distinction matters. The endpoint group describes where districts began and finished. It is not a count of first-time crossings, and it does not turn a path with reversals into a smooth climb.
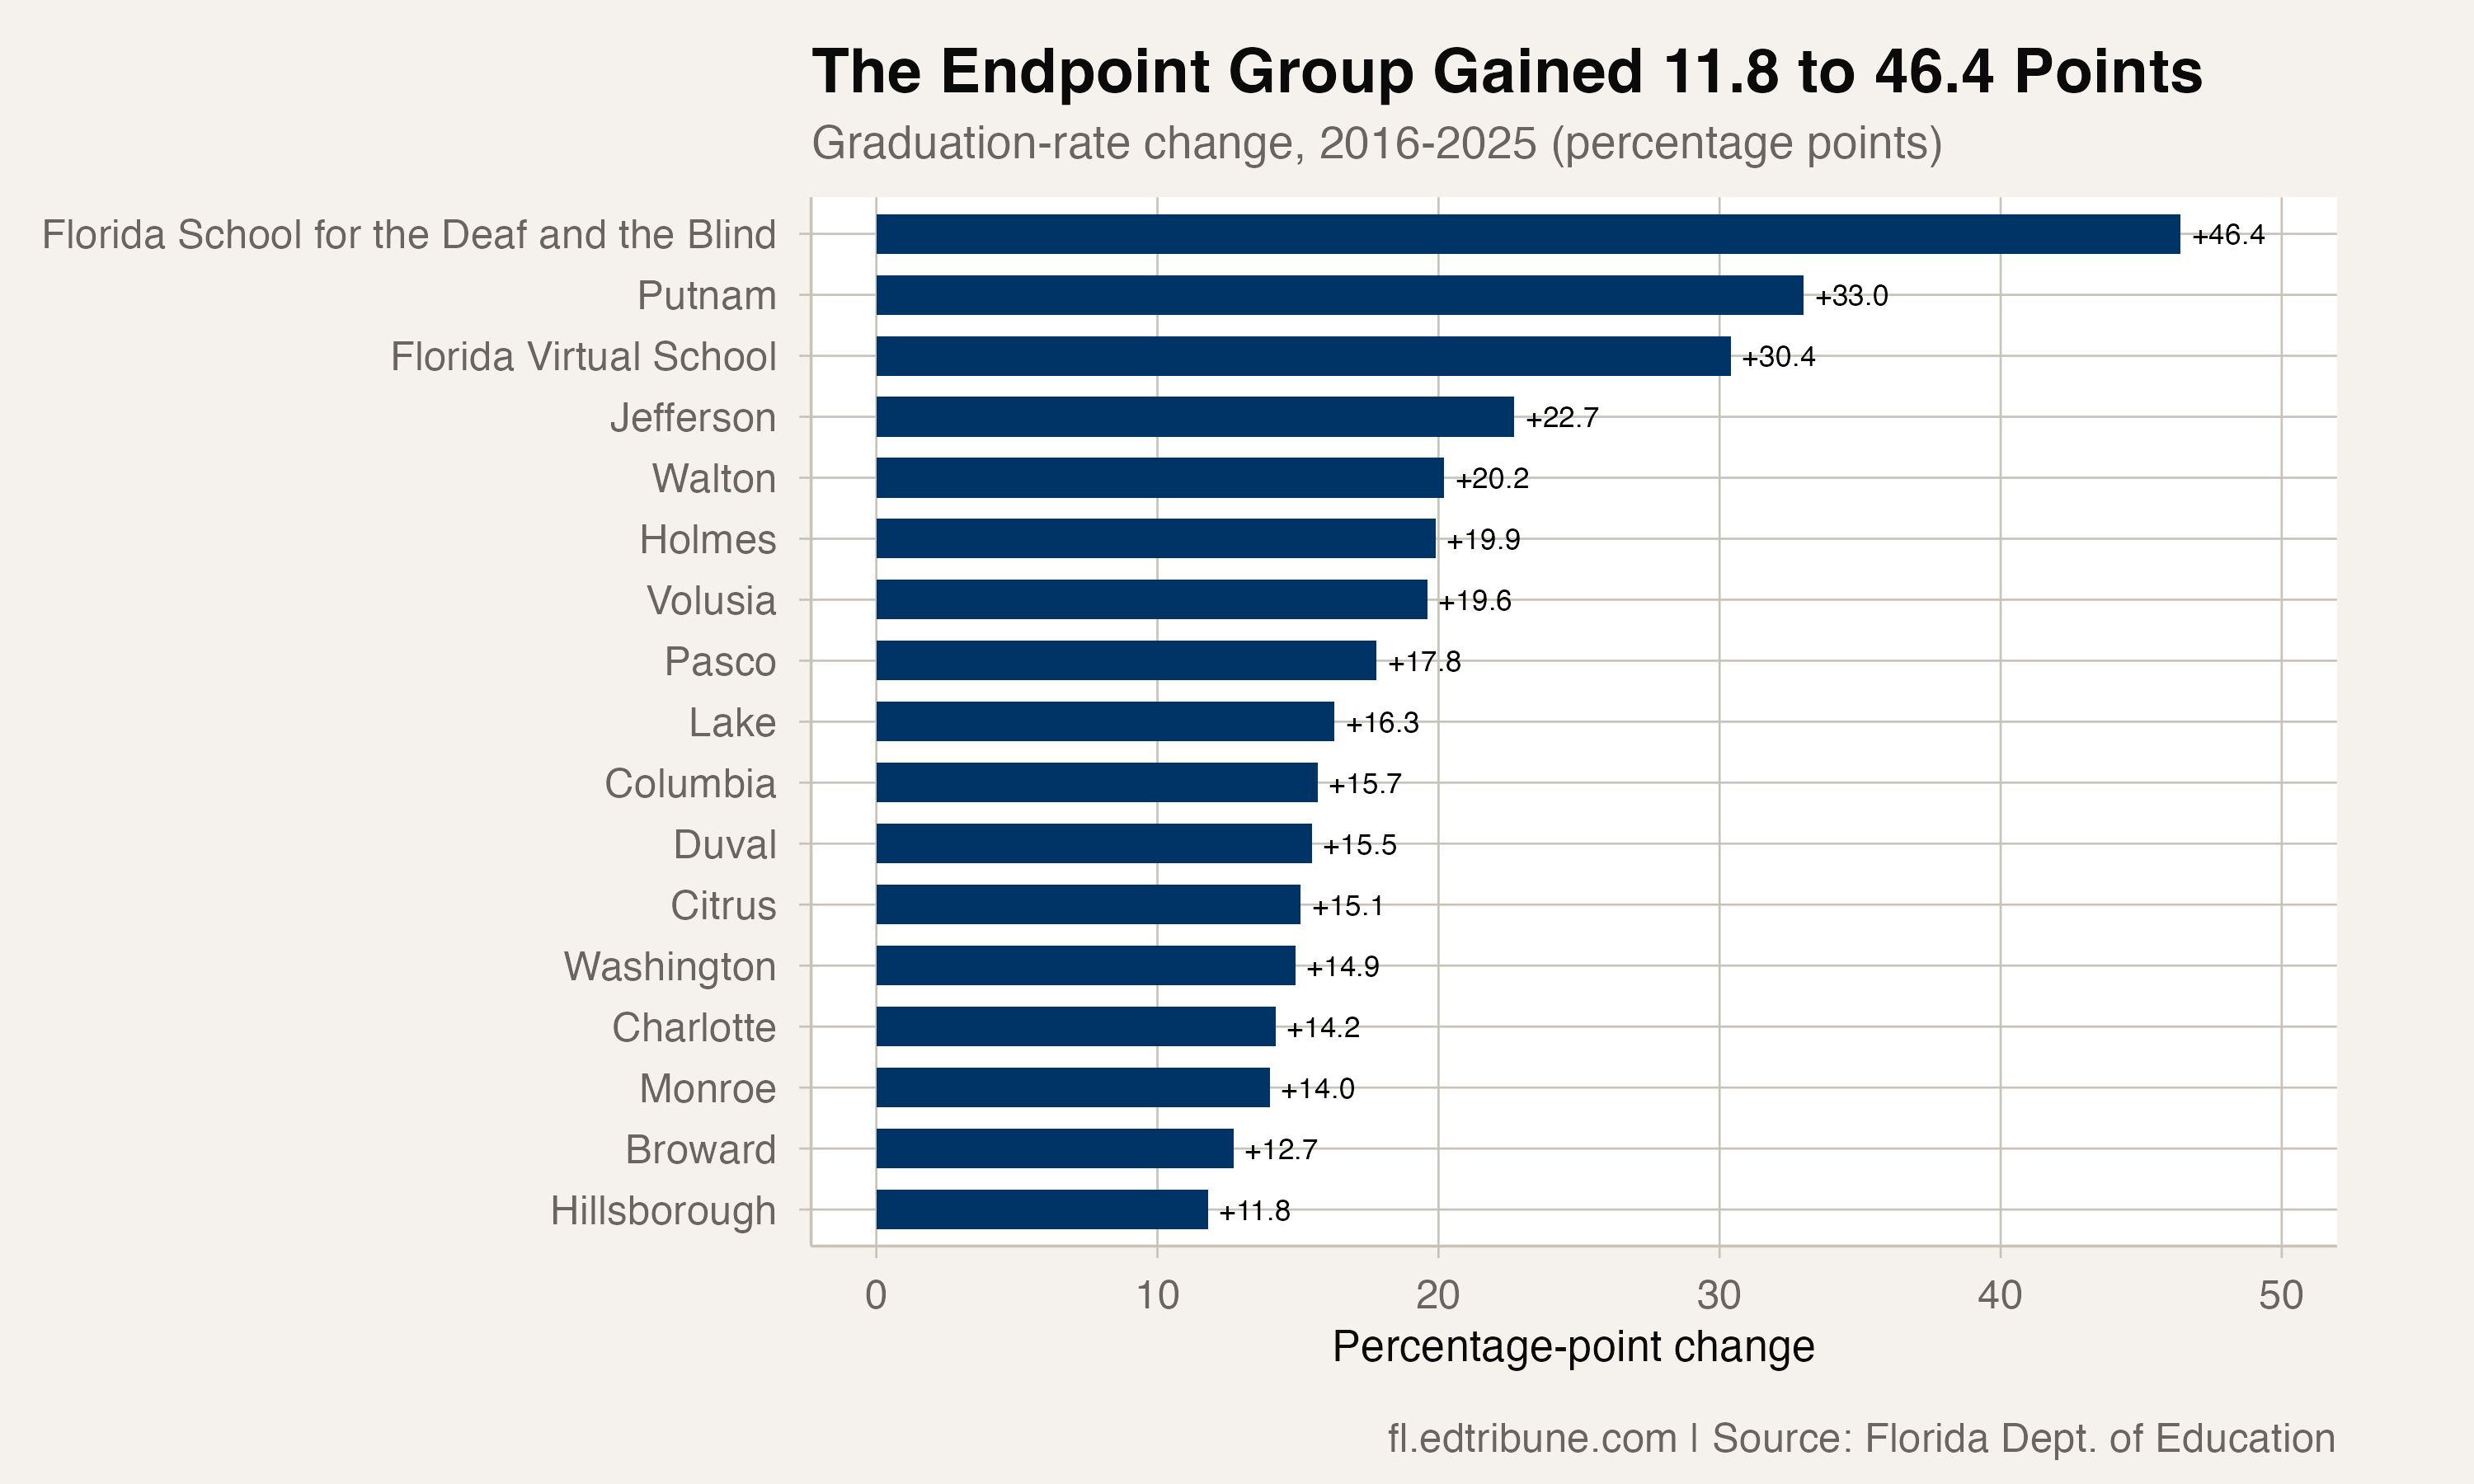
The result spans very different cohort sizes
The 2025 cohorts ranged from 55 students in Jefferson County to 19,373 in Broward County. Hillsborough reported 16,893 students in its cohort, Duval 8,540, Pasco 6,159 and Volusia 4,968. The endpoint pattern therefore appears in both small systems and several of Florida's larger reported district cohorts.
The range also cautions against treating each percentage-point change as the same operational event. A point in a small cohort and a point in a five-figure cohort represent different numbers of students, even though both rates meet the same endpoint rule.
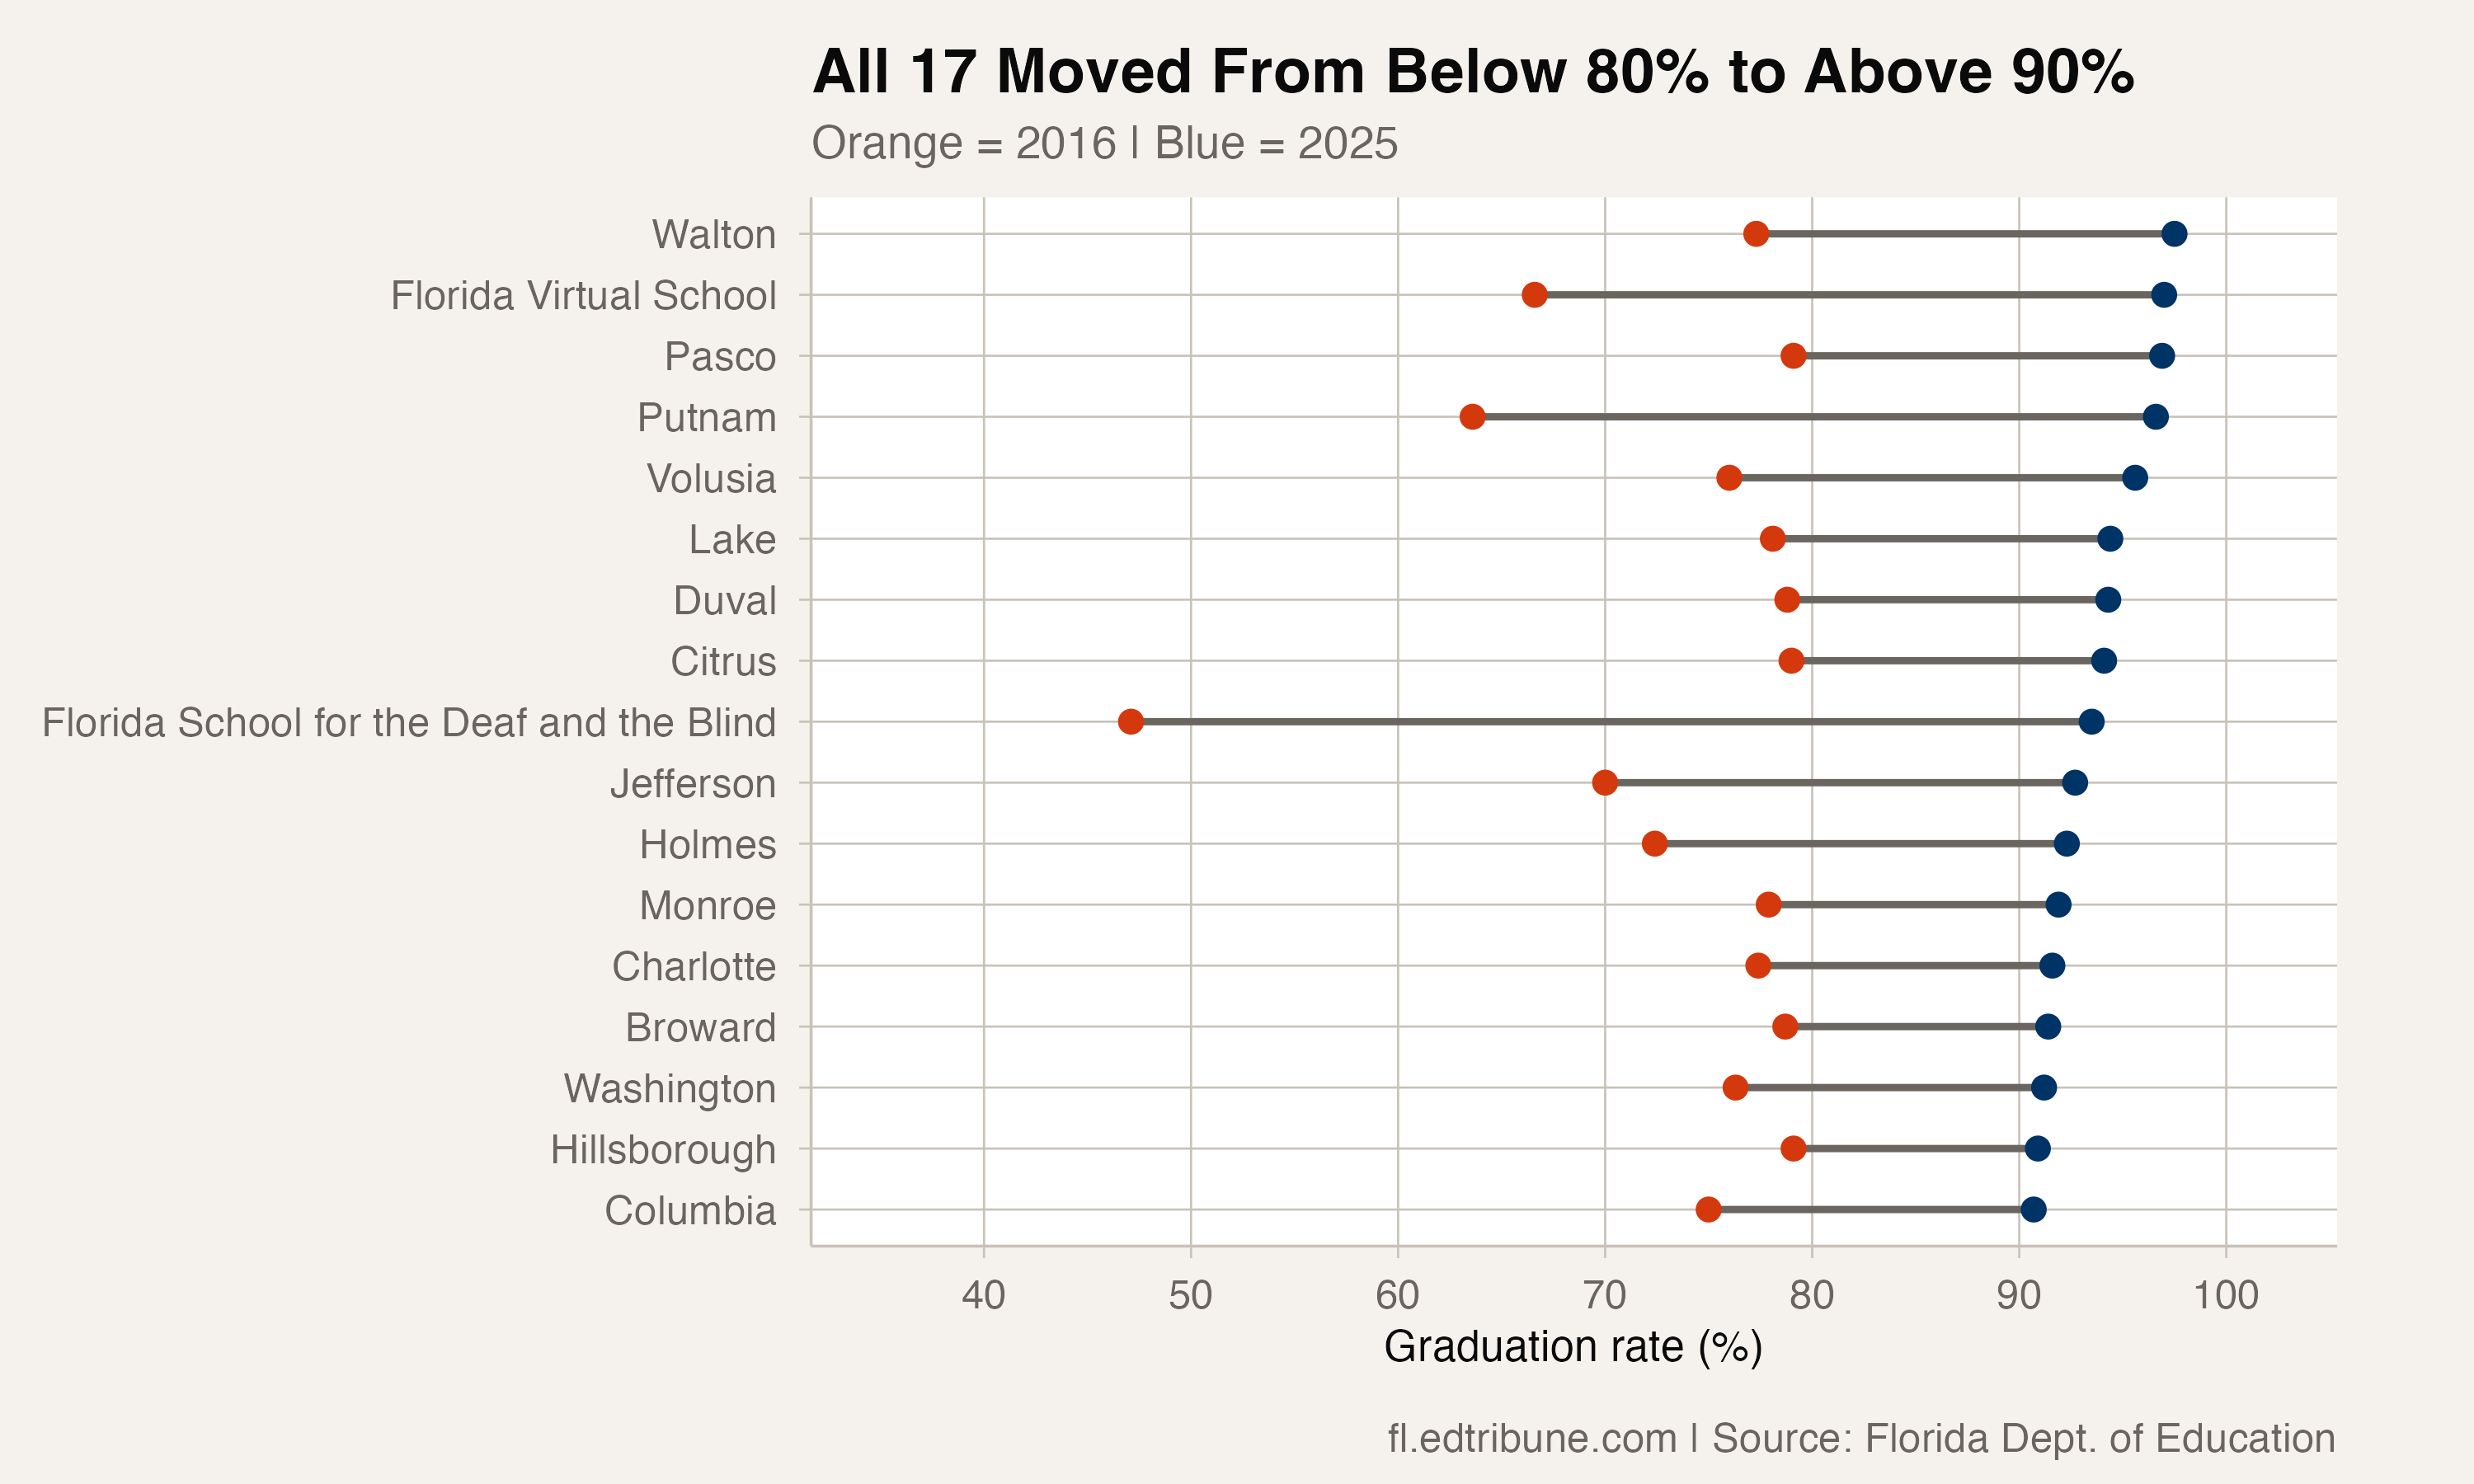
A threshold is a checkpoint, not an explanation
Thirteen of the 17 districts finished 2025 at their highest rate in the available panel. Columbia, Holmes, Monroe, and the Florida School for the Deaf and the Blind ended above 90% but below an earlier high.
Walton has the longest current run above the threshold: six consecutive reporting years from 2020 through 2025. Other districts crossed, fell back, and crossed again. The adjacent-year audit records every one of those direction changes before counting the final group.
The rates establish the outcome but not its cause. District practices remain an unresourced possible explanation, while cohort composition and reporting conditions are competing explanations that the graduation records alone cannot separate. The useful question for local leaders is whether the gains persist in later cohorts and which documented changes, if any, line up with that durability.
Graduation rates and cohort counts come from the Florida Department of Education's Federal Graduation Rate by Category files.
Detailed code that reproduces the analysis and figures in this article is available exclusively to EdTribune subscribers.
Discussion
Sign in to join the discussion.
Loading comments...