Putnam County↗ET was the second-worst-performing district in Florida in 2016. Just 63.6 percent of its seniors graduated, a full 17 percentage points below the state average. Eight years later, Putnam graduates 91.2 percent of its students, 1.5 points above that same state average.
The 27.6 percentage-point improvement is the largest of any Florida county district with a cohort above 500 students. It is, by the numbers, one of the most dramatic graduation turnarounds of any district in any state we have analyzed.
The climb, year by year
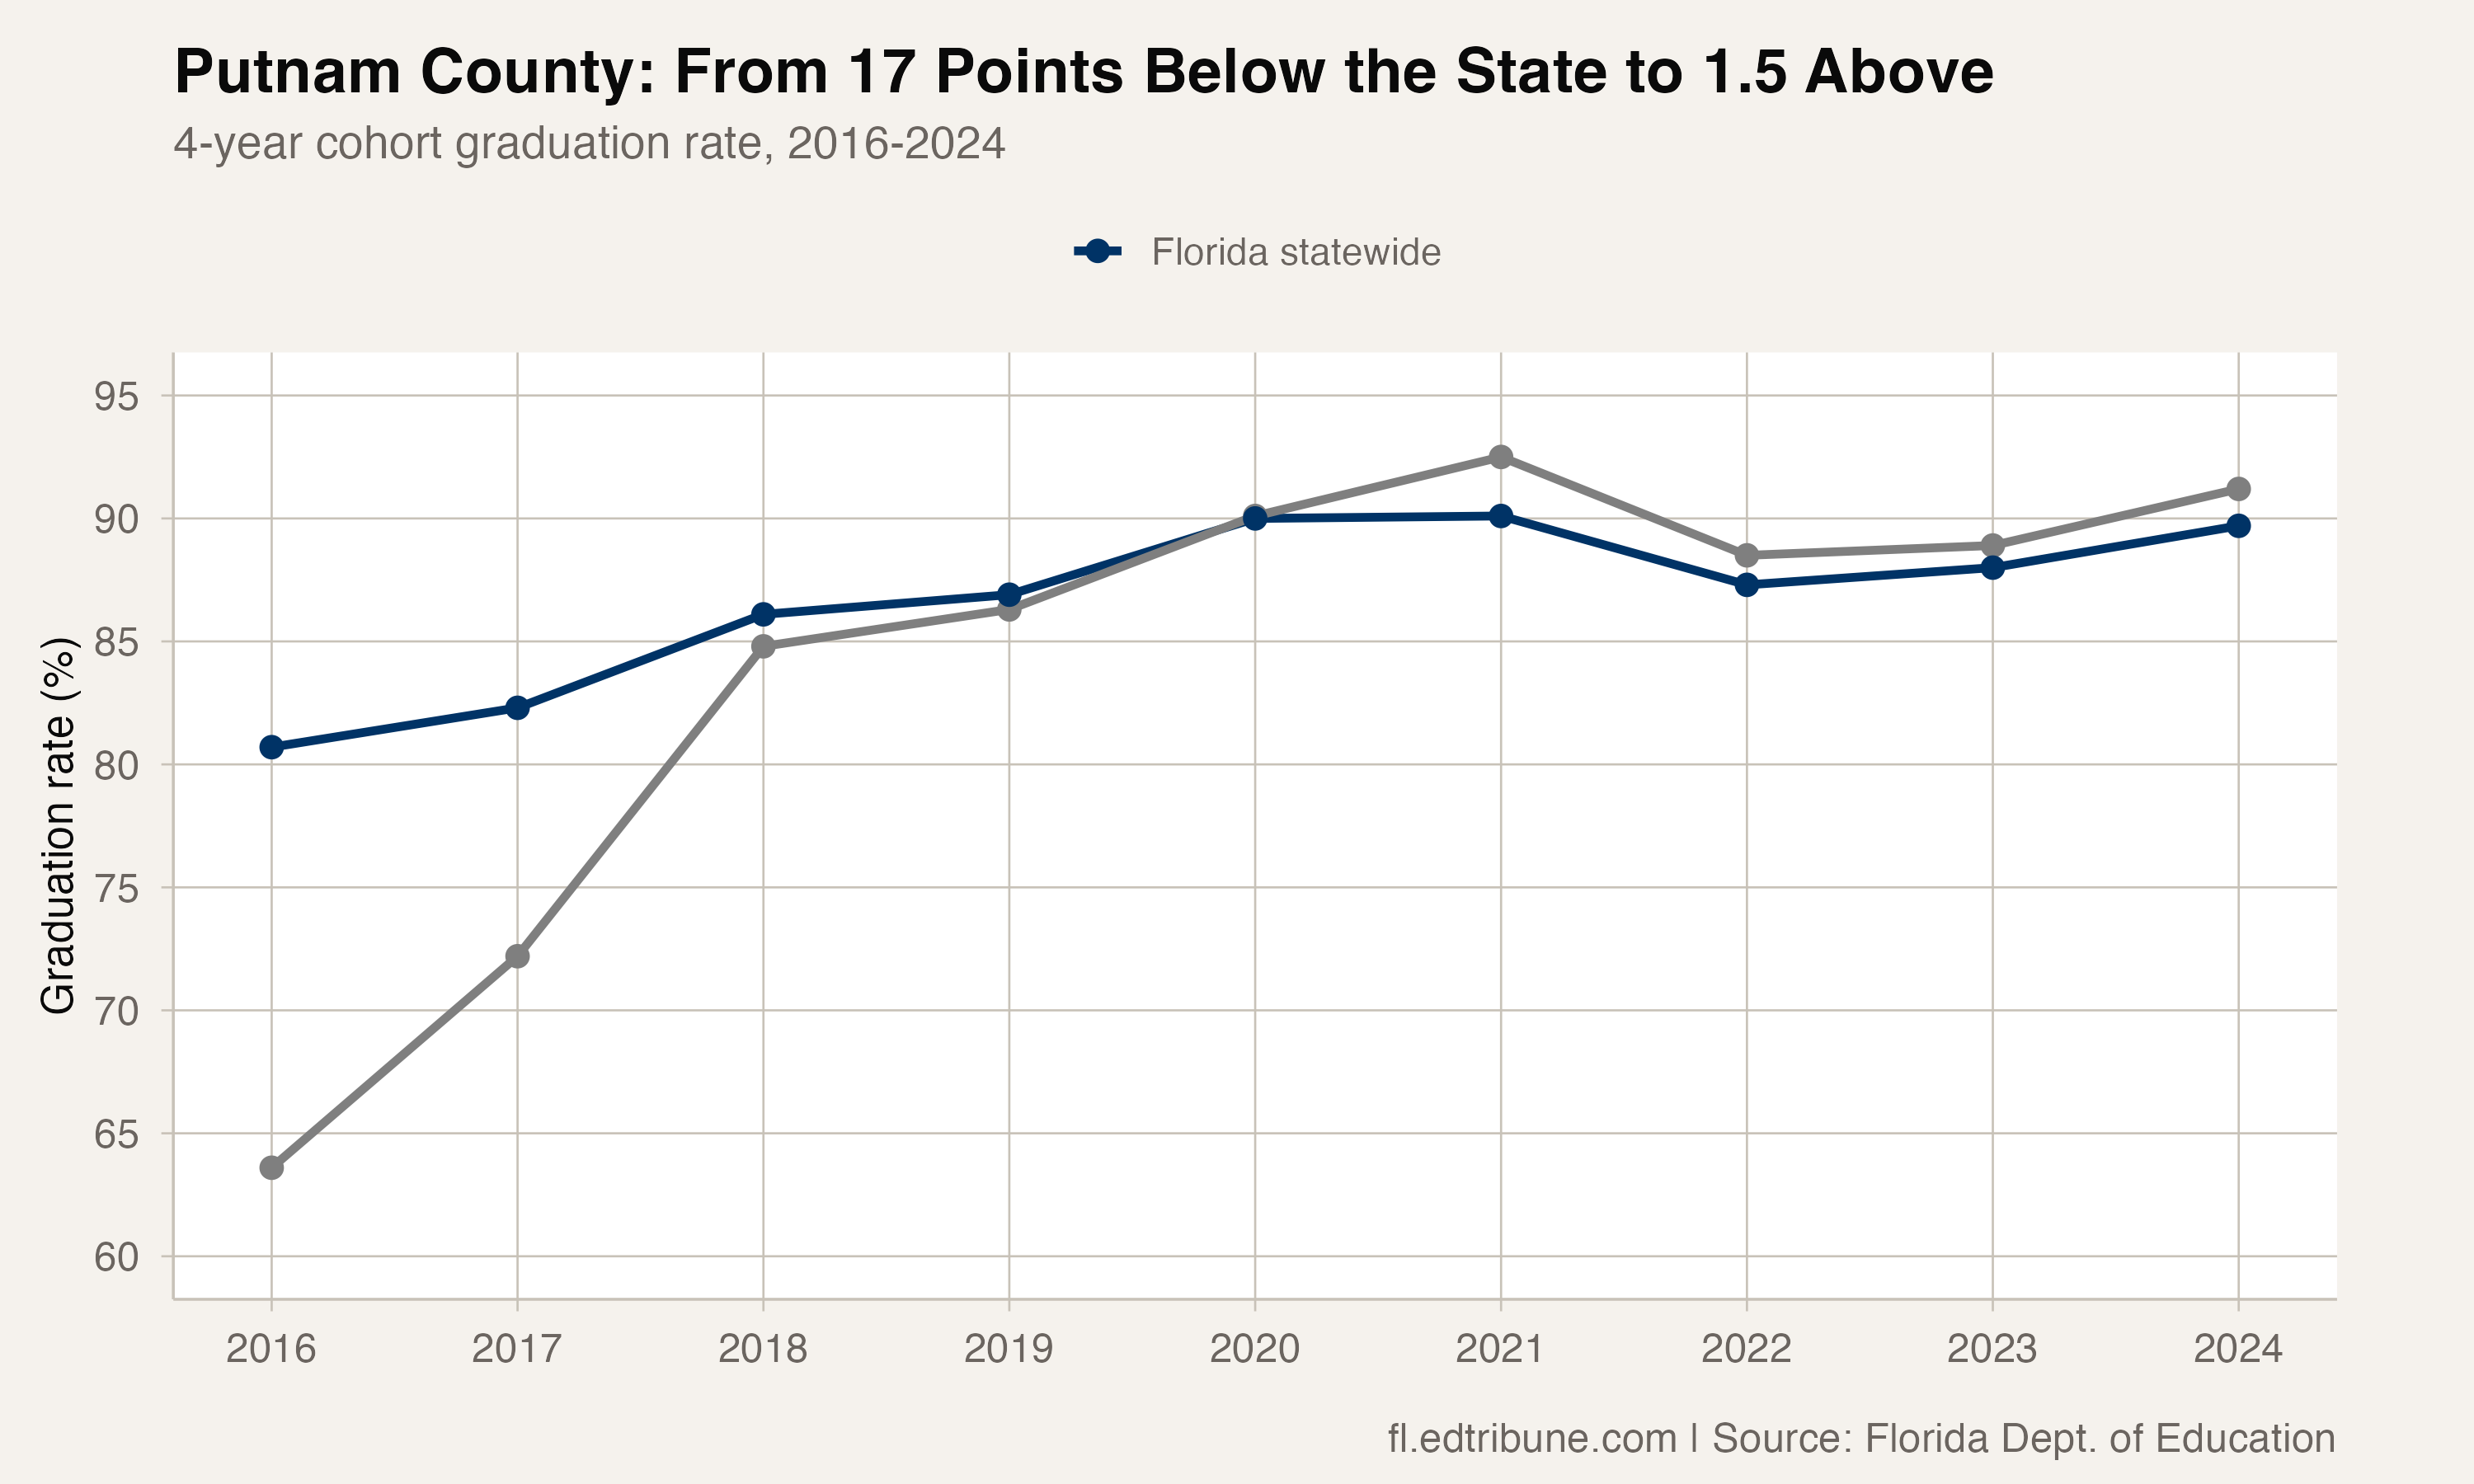
Putnam's trajectory began with an astonishing 8.6-point jump from 63.6 to 72.2 percent between 2016 and 2017. The following year brought another enormous gain, a 12.6-point leap to 84.8 percent. In the space of two years, Putnam had vaulted from failing to functional.
The gains continued more modestly from there: 1.5 points in 2019, then a 3.8-point boost in 2020 that pushed the rate above 90 percent for the first time. The COVID waiver year of 2021 saw a 92.5 percent mark, Putnam's highest.
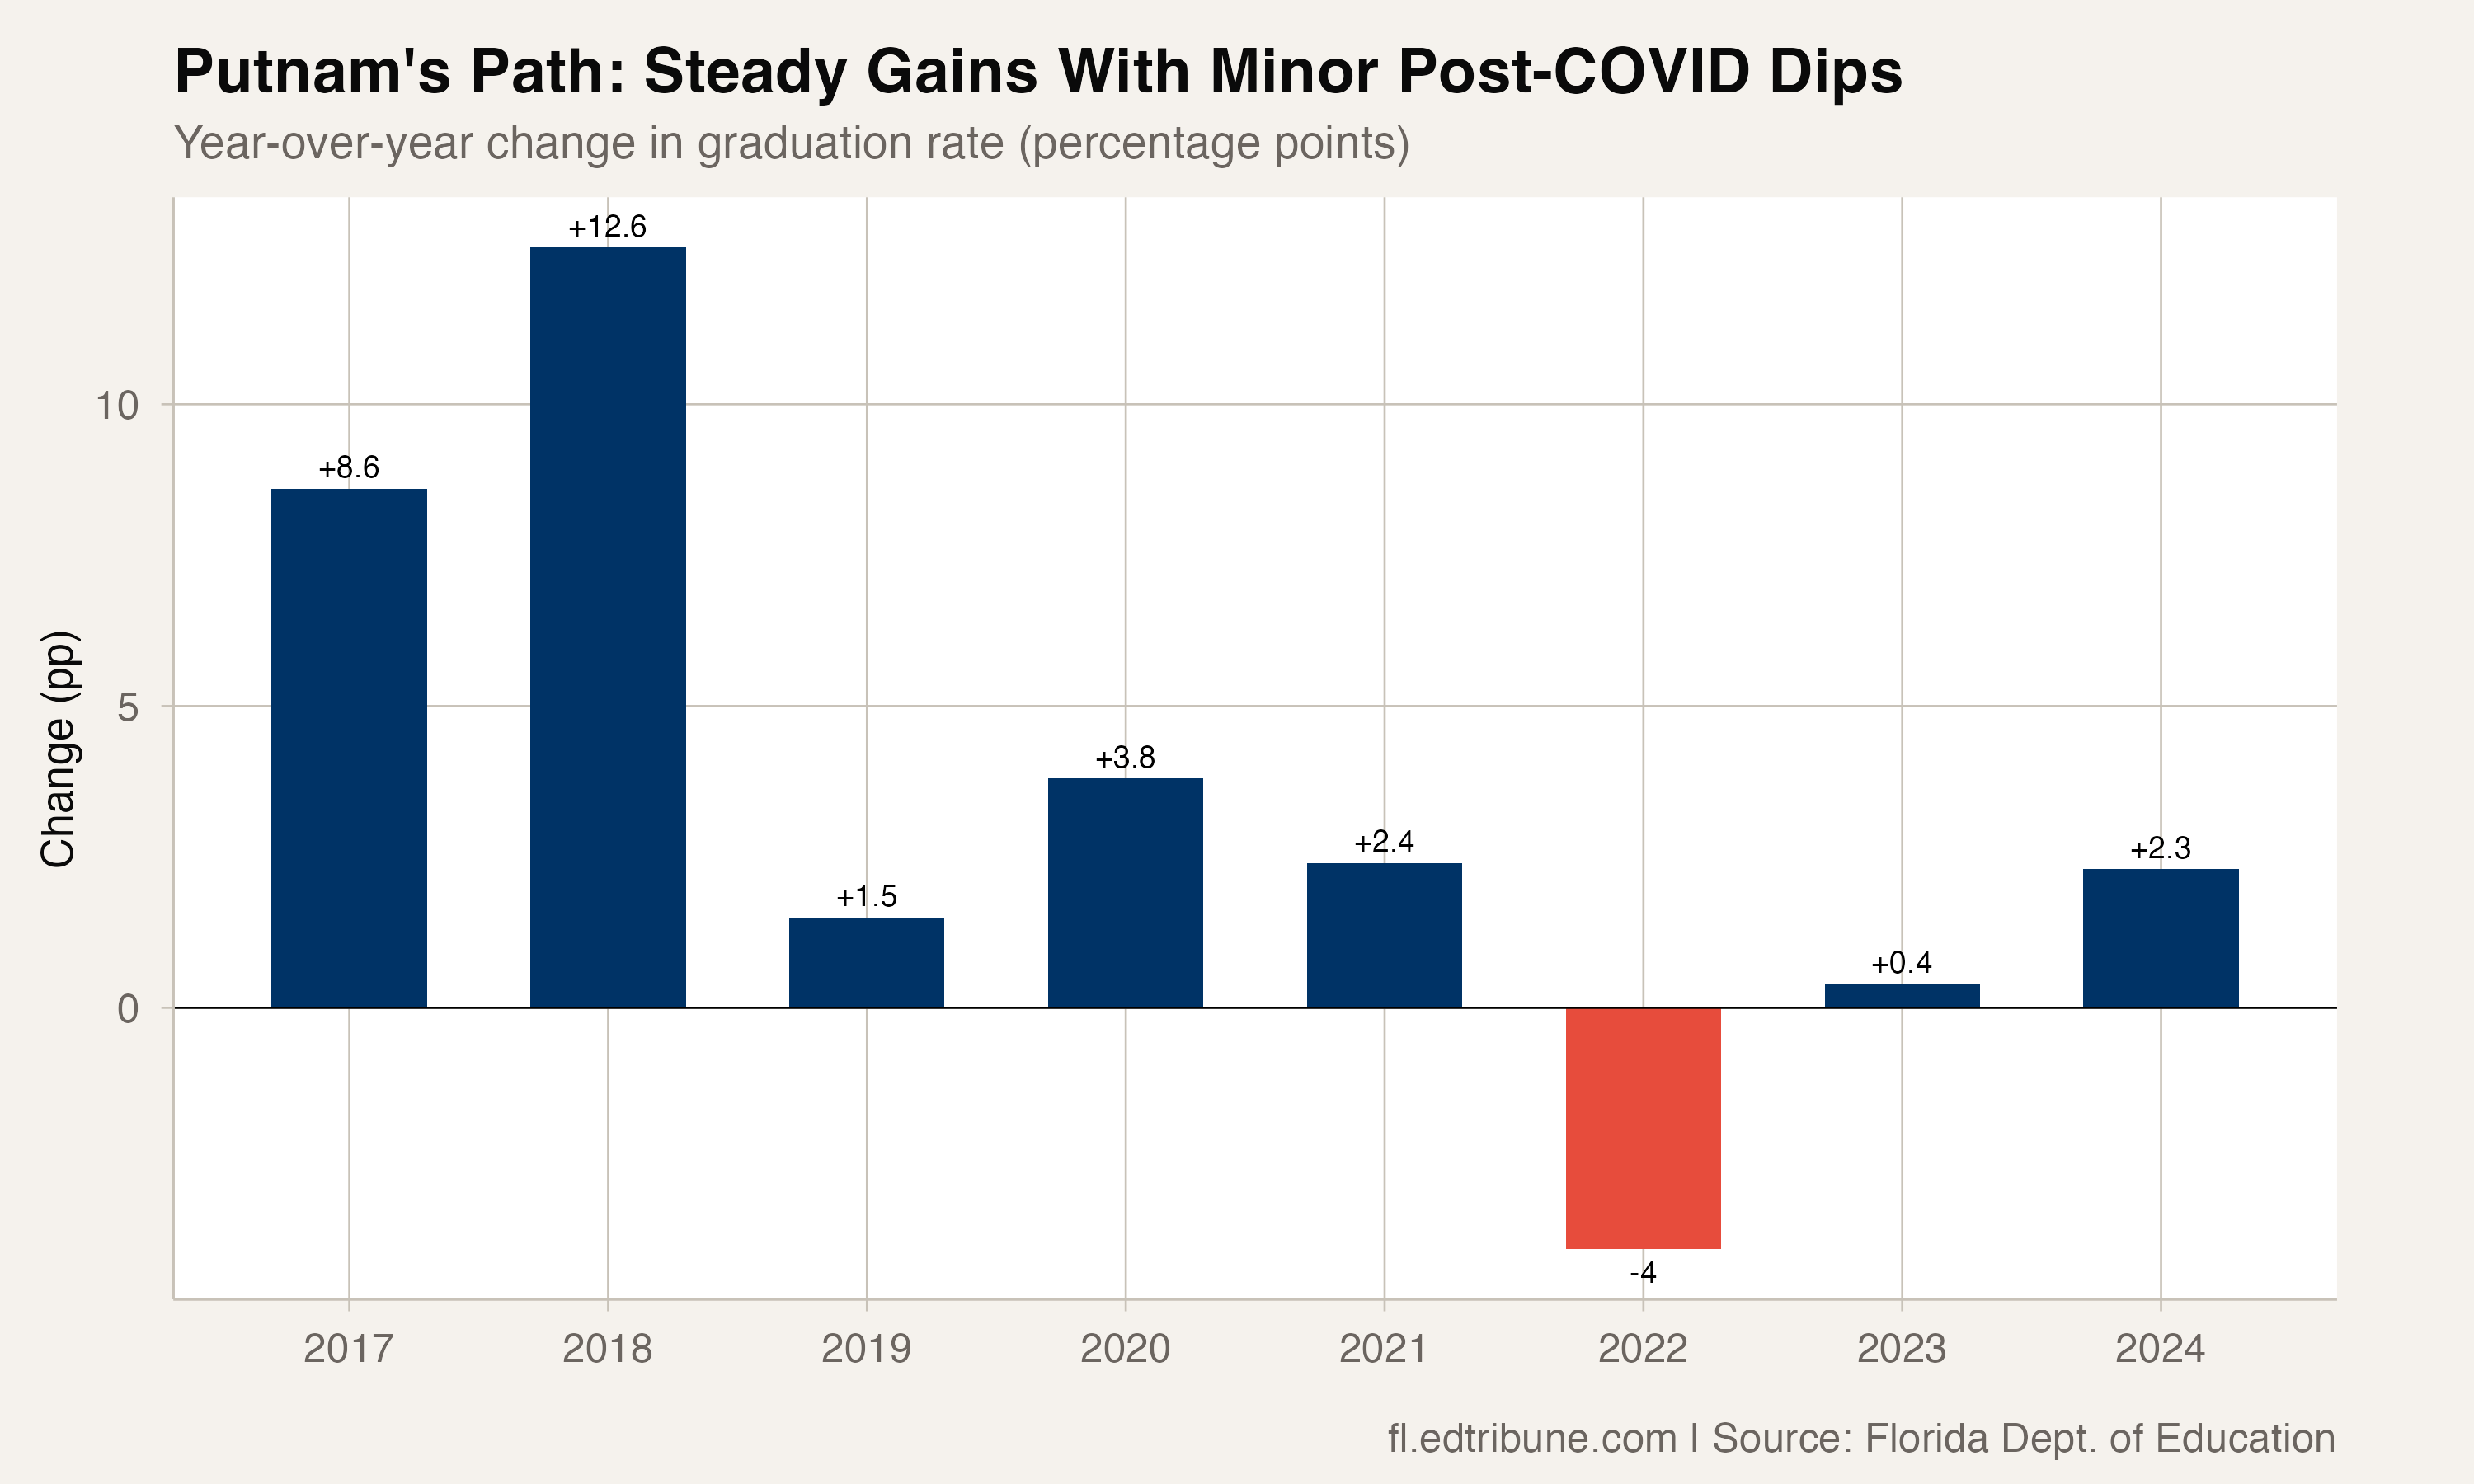
When assessment requirements returned in 2022, Putnam's rate dropped 4.0 points to 88.5 percent. But this correction was less severe than the state's 2.8-point drop would suggest for a district starting from a higher base. Putnam recovered quickly, posting 88.9 percent in 2023 and then 91.2 percent in 2024.
The critical point: Putnam's current 91.2 percent rate was achieved without assessment waivers and exceeds the state average. The turnaround has stuck.
Every subgroup improved
The most extraordinary number in Putnam's data is not the overall rate. It is what happened to students with disabilities.
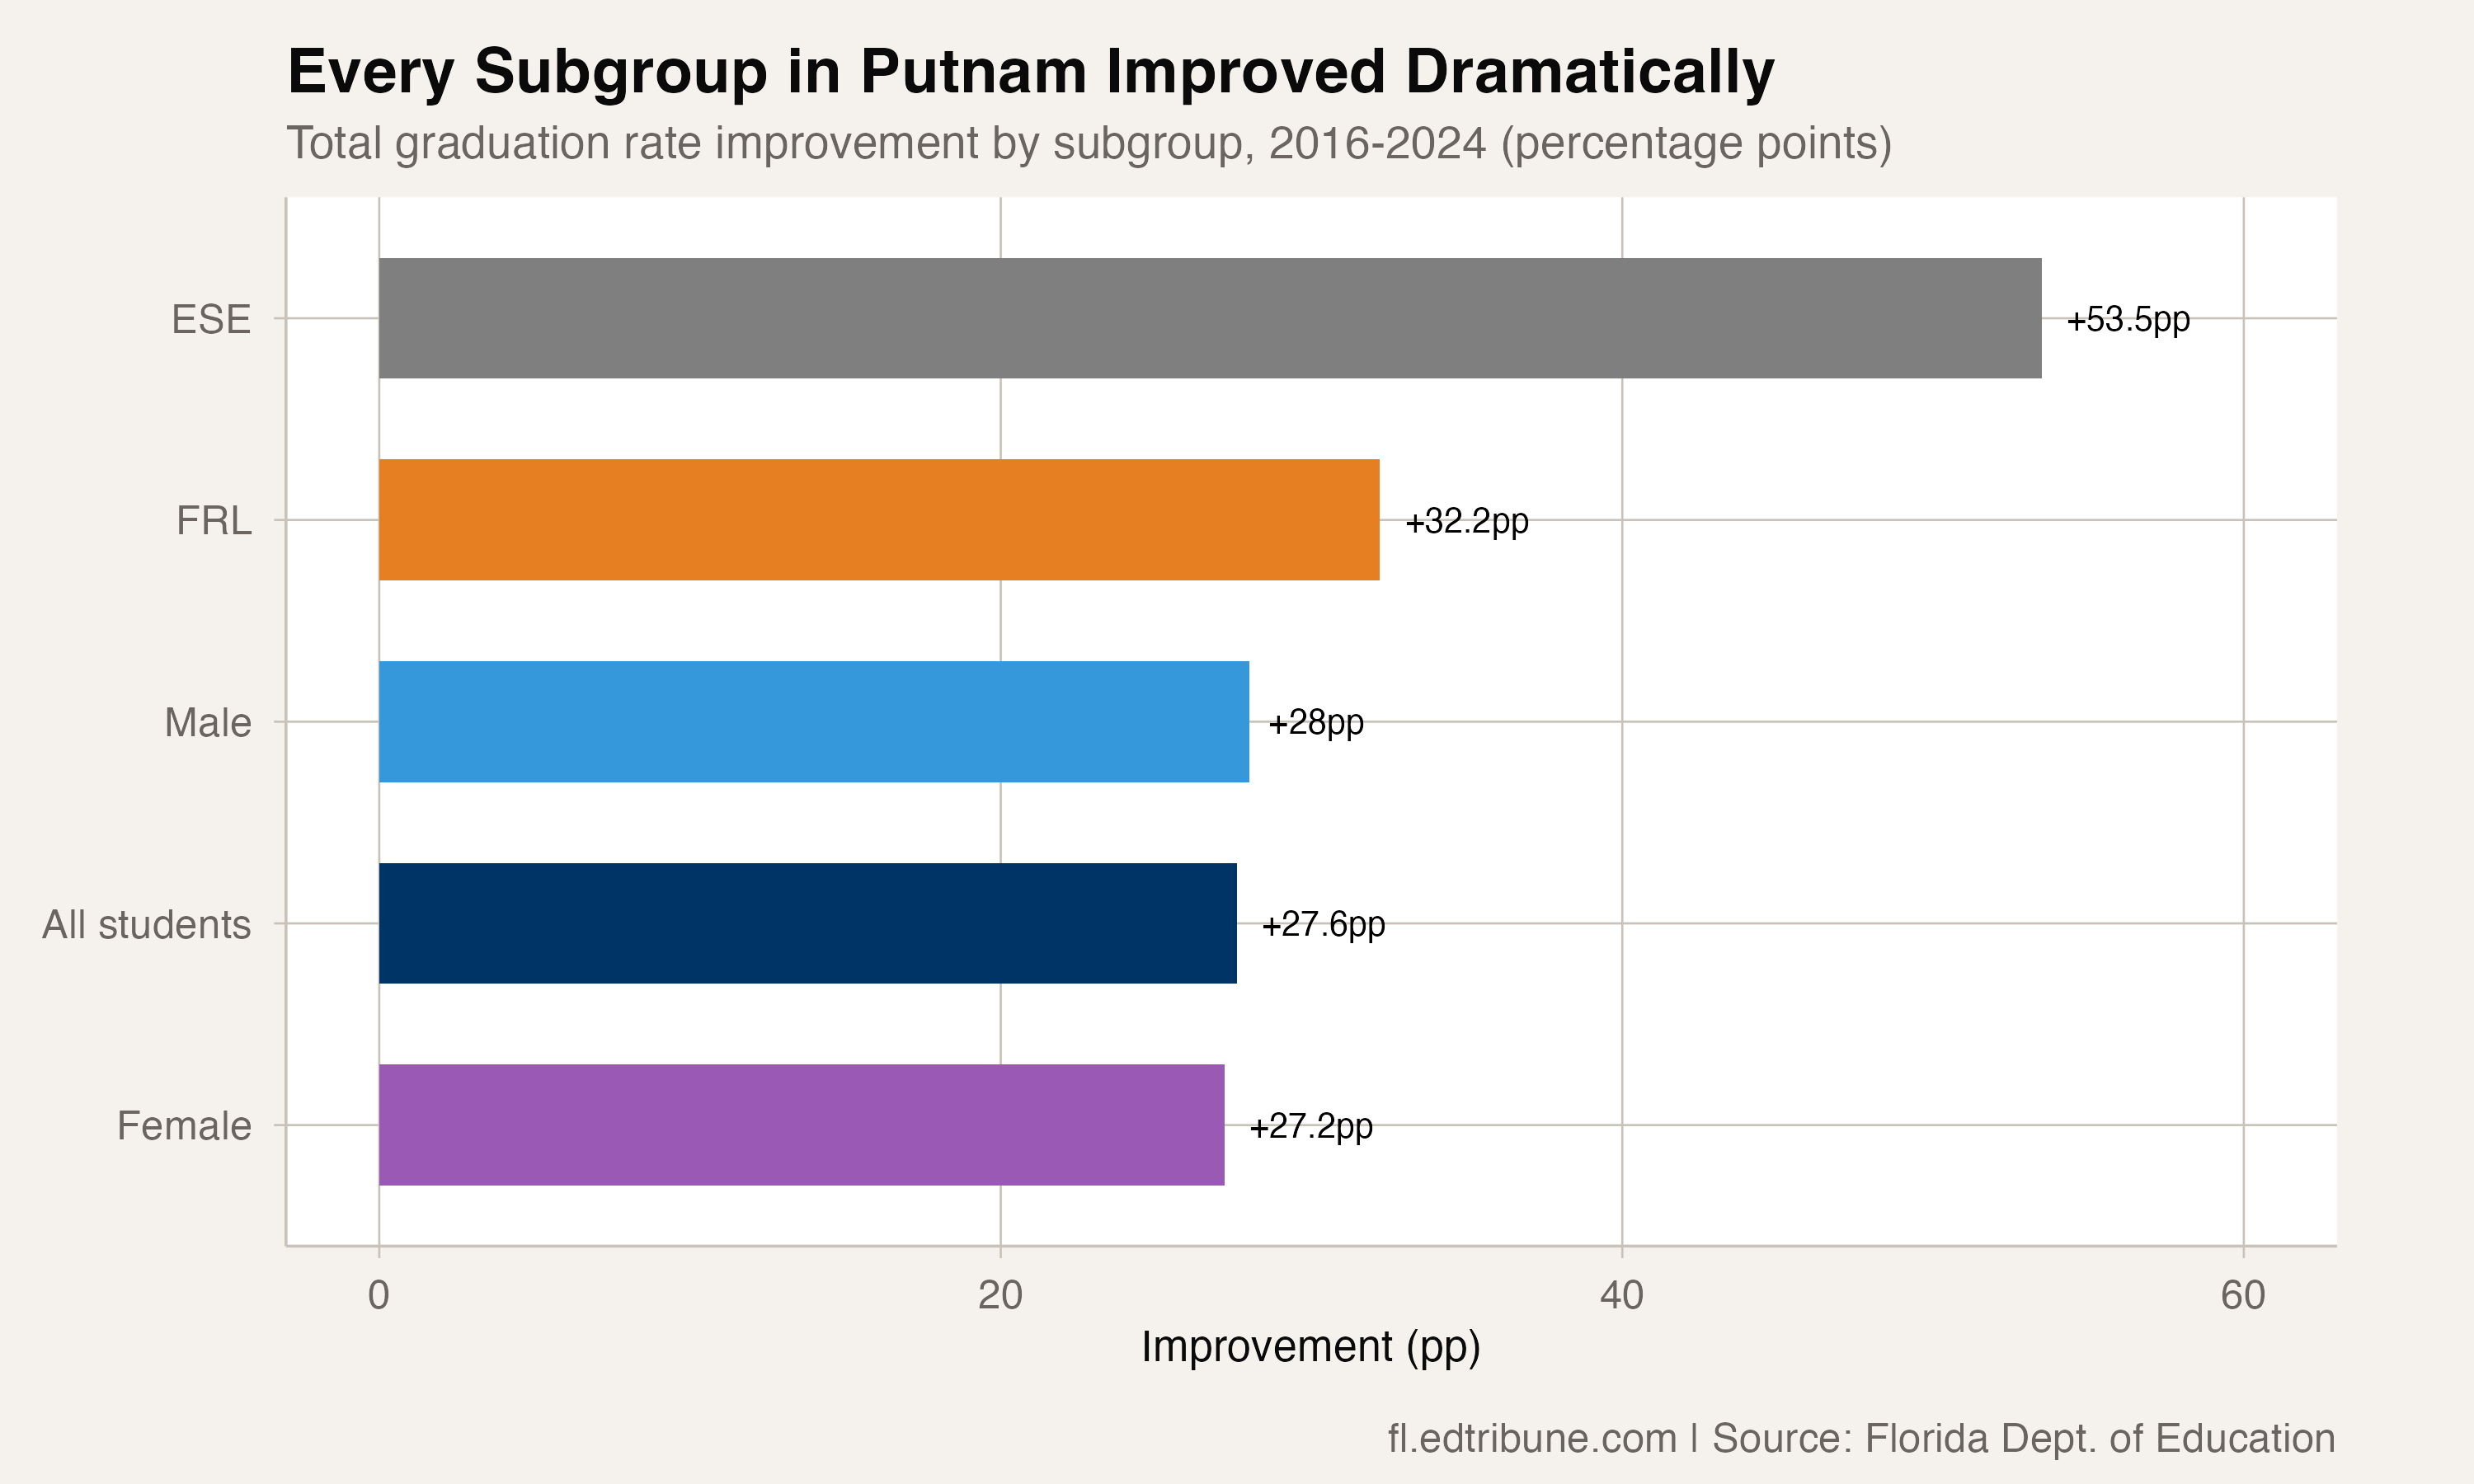
Students with disabilities in Putnam graduated at 35.6 percent in 2016. In 2024, they graduated at 89.1 percent. That is a 53.5 percentage-point improvement, meaning Putnam went from graduating roughly one in three students with disabilities to nearly nine in ten.
Students who are economically disadvantaged followed a similar path, climbing 32.2 points from 56.9 to 89.1 percent. English learners reached 100 percent graduation in 2024, though the cohort size for that group in this small, rural district is small enough that individual students can shift the rate substantially.
Male graduation rates improved by 28 points, from 59.1 to 87.1 percent. Female rates improved by 27.2 points, from 68.0 to 95.2 percent. By 2024, the gender gap in Putnam had narrowed to 8.1 points.
A rural county, not a suburb
Putnam County sits along the St. Johns River in North Central Florida, about an hour south of Jacksonville. The county seat is Palatka. The population is roughly 75,000. This is not a fast-growing suburban community with demographic tailwinds pushing numbers up. Putnam's graduating cohort actually shrank over this period, from 686 students in 2016 to 668 in 2024.
The improvement happened despite a smaller cohort, which makes it harder to dismiss as an artifact of changing demographics or selective enrollment.
What the data cannot explain
The data show what happened but not how. A 27.6-point improvement in eight years, concentrated in the first two years and then sustained, suggests intentional intervention rather than natural drift. Districts that improve by 5 or 6 points typically get attention. Districts that improve by 28 points in a sustained way are genuinely rare.
The fact that every subgroup participated in the improvement, and that students with disabilities improved by more than 50 points, points to systemic changes in how the district approaches graduation rather than targeted programs for specific populations.
Detailed code that reproduces the analysis and figures in this article is available exclusively to EdTribune subscribers.
Discussion
Sign in to join the discussion.
Loading comments...