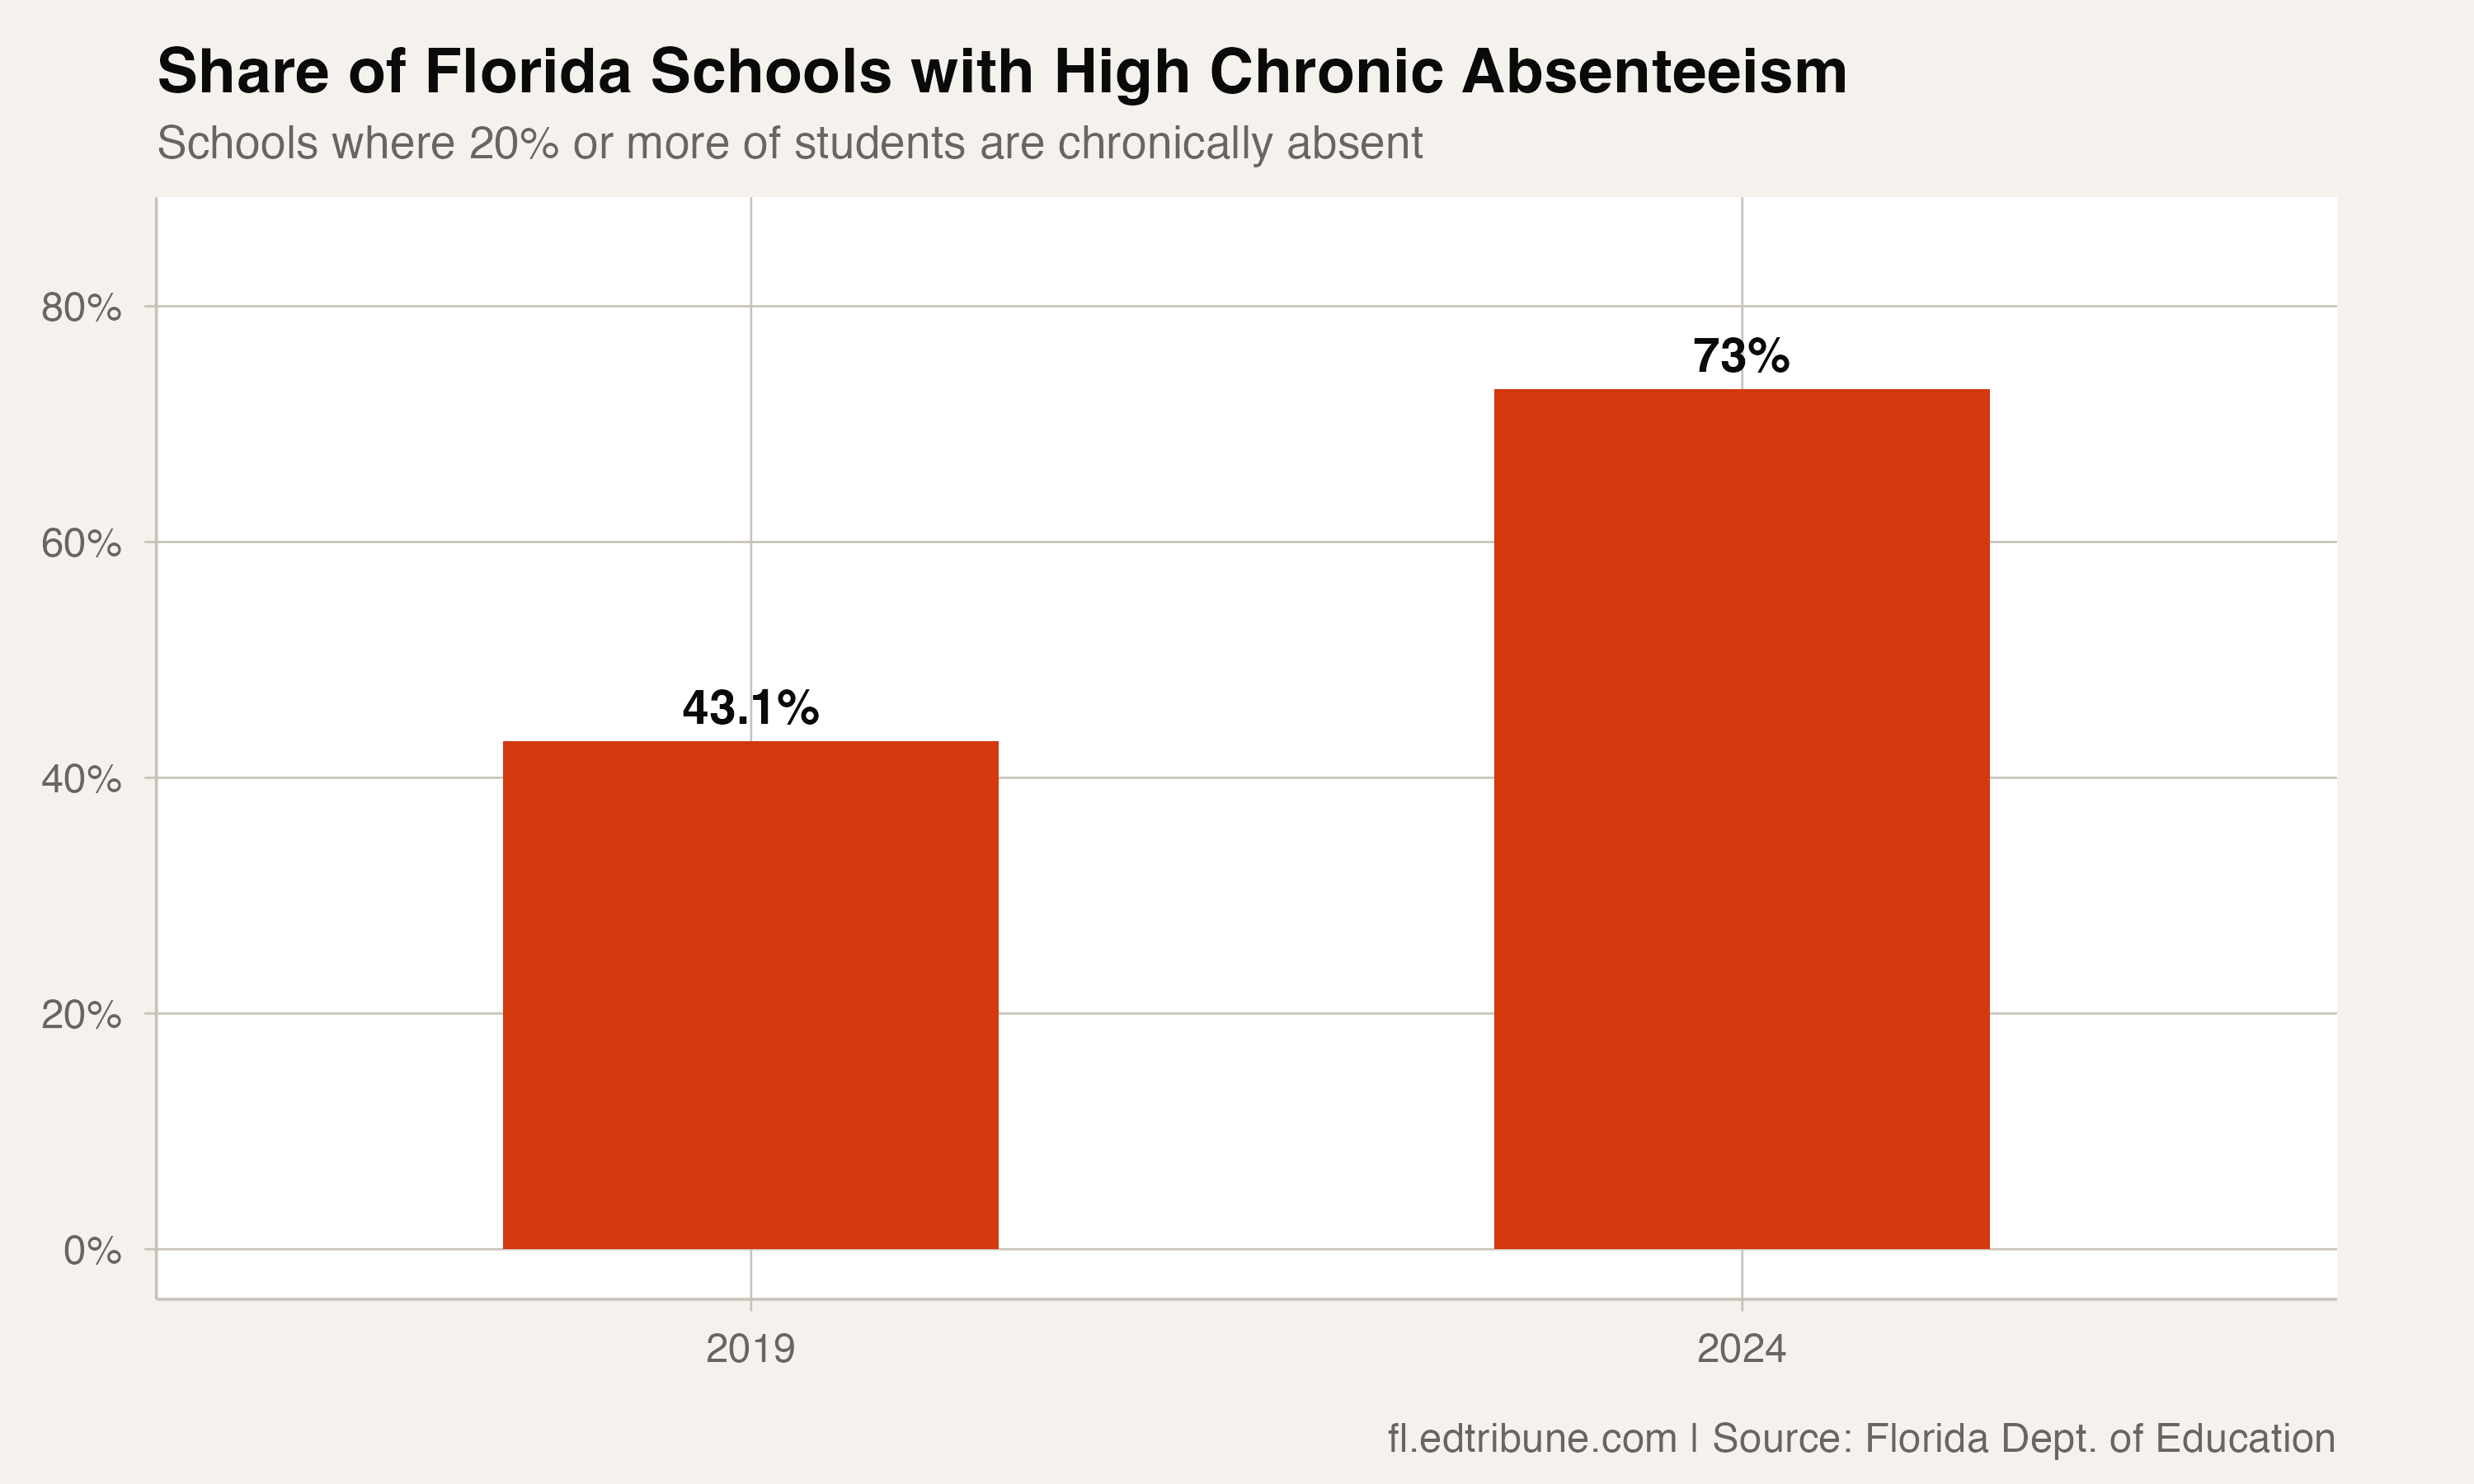
Florida's chronic absenteeism crisis is past its peak. The share of public schools with high chronic absenteeism, rates of 20% or higher, climbed to 76.3% in 2021-22 in the pandemic's wake. By 2023-24 it had eased to 73.0%, or 2,884 of 3,953 schools, with roughly one in four schools now back below the threshold. The retreat is real, but slow, and the share remains far above the pre-pandemic level of about 43%.
Part of the Florida Chronic AbsenteeismET series.
A 30-point shift in five years
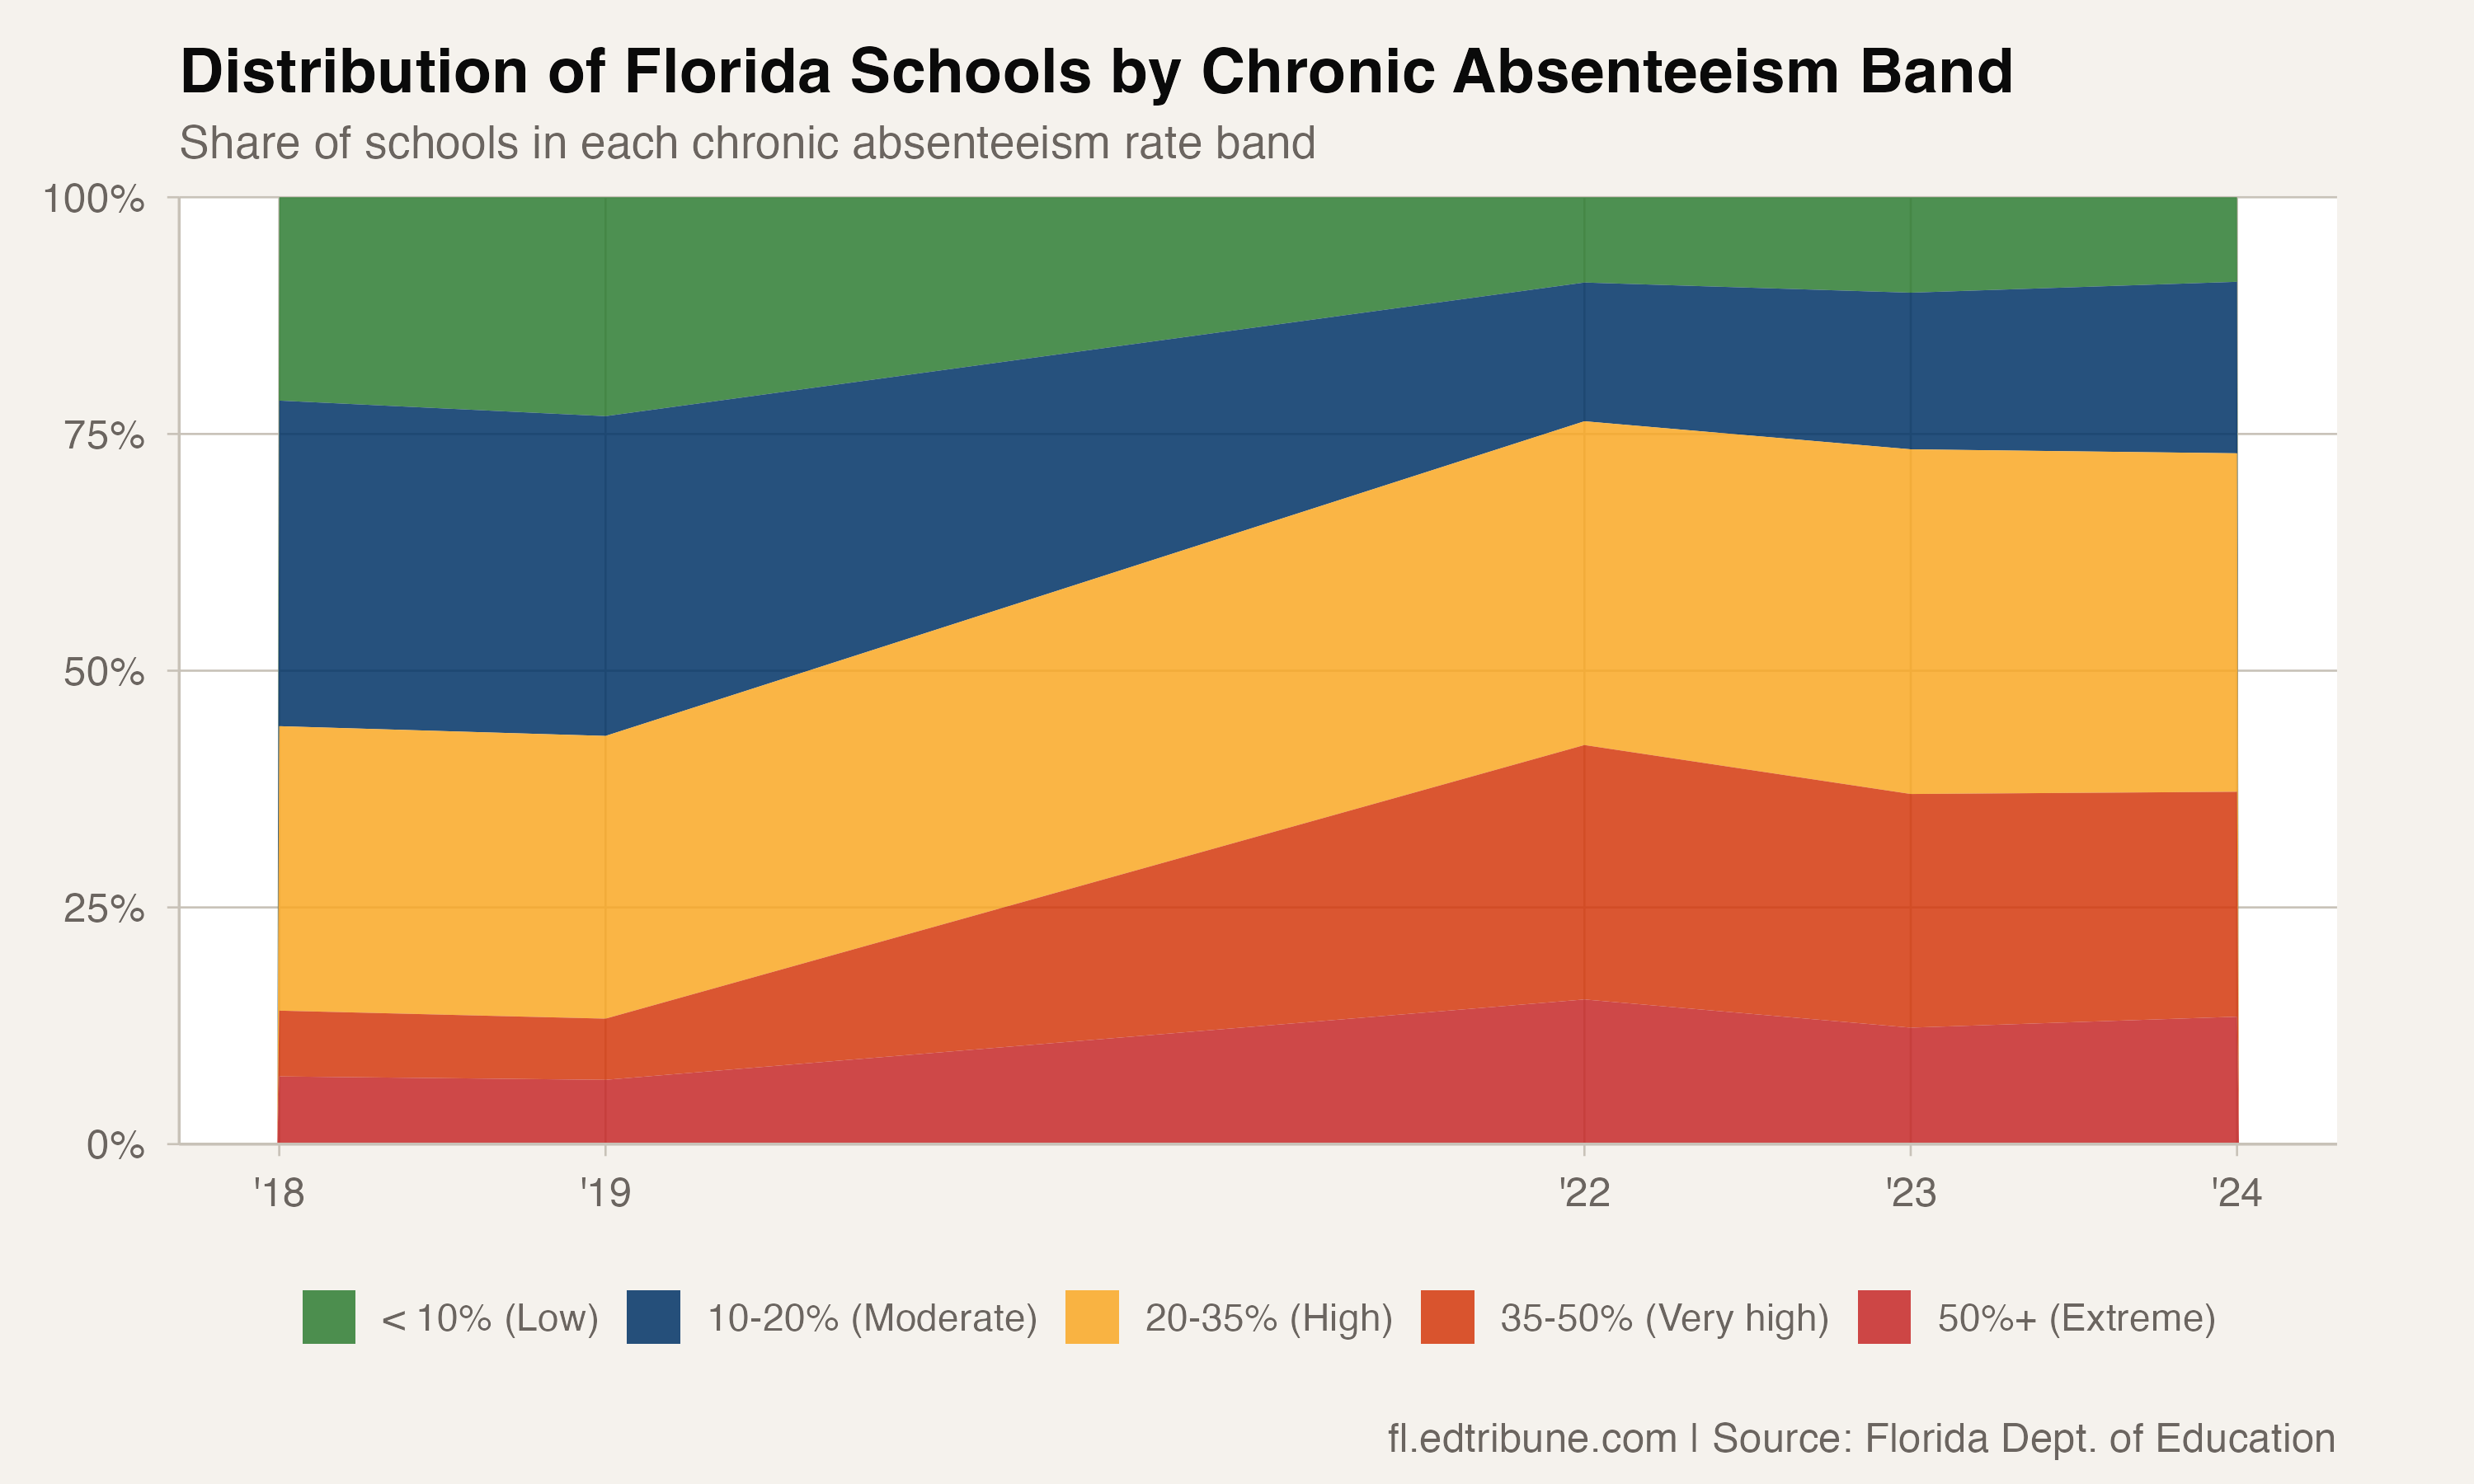
The transformation is visible in the stacked bands of school performance. In 2018-19, a comfortable majority of Florida schools fell below the 20% chronic threshold, with many in the single-digit range. By 2021-22, the distribution had flipped: 76.3% of schools cleared the threshold, pushed there by the pandemic's aftereffects. Two years later, the share has barely retreated, sitting at 73.0%.
The stability of that number is the concerning part. Between 2022 and 2024, the share of high-absence schools moved from 76.3% to 73.0%, a three-point improvement across two school years. At that pace, returning to the pre-COVID share of 43% would take roughly two decades.
The schools above 50%
At the extreme end, 496 Florida schools had a majority of their students chronically absent in 2023-24, collectively enrolling 333,126 students. These are buildings where the absent students outnumber the present ones on a typical day, where a teacher's lesson plan is designed for an audience that is more absent than not.
The list includes alternative schools and acceleration centers, where high absence rates are expected by design. These serve students who have already disengaged from traditional schooling. But it also includes traditional neighborhood elementary, middle, and high schools. When a regular campus hits 50% chronic absenteeism, something more fundamental than individual student choice is at work.
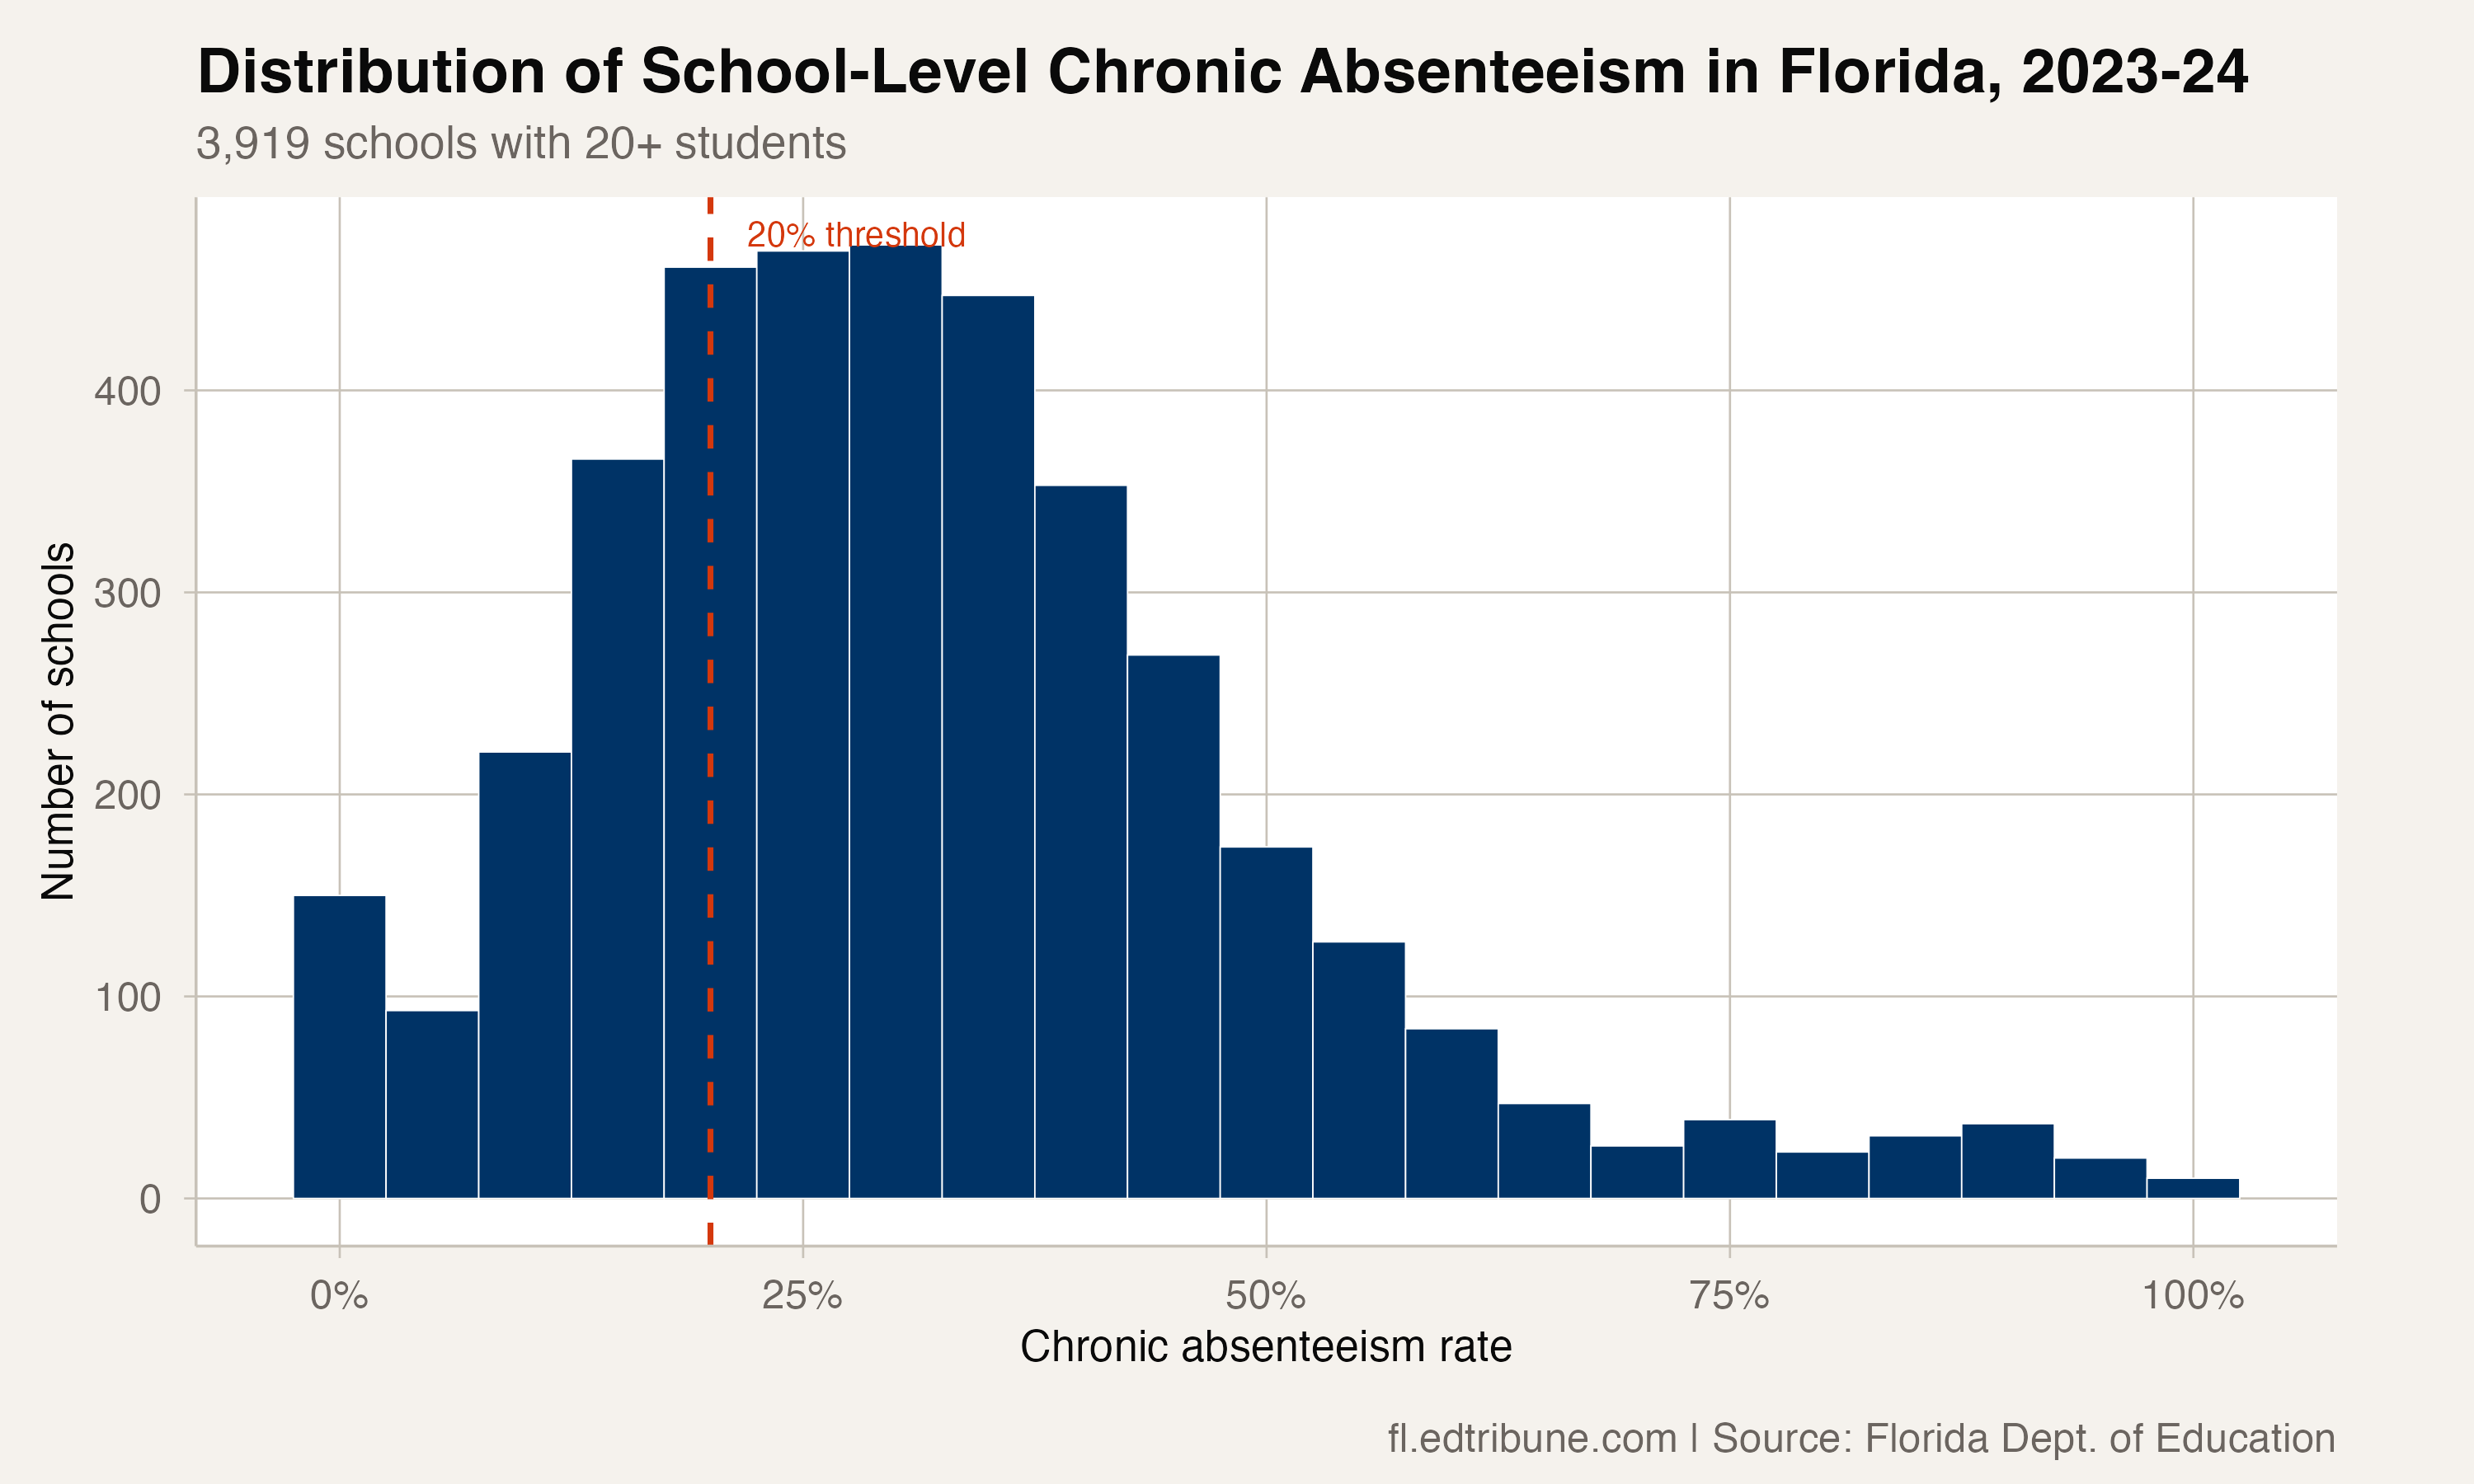
The histogram of school-level rates in 2023-24 tells a story that the statewide average obscures. The bulk of schools cluster between about 20% and 35%, but the distribution is far from symmetric. It carries a long, heavy right tail: hundreds of schools sit past 50%, more than 250 past 60%, and over 100 past 80%. That tail drags the average above the typical school. Most schools are not catastrophic, but the worst ones are far worse than any single statewide number lets on.
What 73% means for policy
When fewer than half of schools had high absenteeism, targeted interventions made strategic sense. Identify the buildings with the worst numbers, deploy attendance specialists, work with community organizations. The approach assumed that the problem was contained enough to address school by school.
At 73%, the problem has outgrown the tools designed to fix it. Targeted interventions assume you can isolate the sick buildings from the healthy ones. When three out of four buildings are sick, the entire system needs treatment.
Florida's accountability system grades schools primarily on test performance, which means a school can earn an "A" while a third of its students barely show up. The 496 schools above 50% chronic absence are not invisible to the state. Their numbers appear in the same databases as everyone else's. But there is no attendance equivalent of the school grade, no public ranking that forces a district to explain why most of its students are missing most of the time.
Detailed code that reproduces the analysis and figures in this article is available exclusively to EdTribune subscribers.
Discussion
Sign in to join the discussion.
Loading comments...